
Blog
Insights for healthier, energy-efficient buildings
Practical articles on indoor climate, ventilation, energy savings and the regulations shaping how buildings are run.
Latest articles
Why most buildings ventilate on a schedule instead of on need
Ventilation is sized for the fullest room and switched by a clock. Why schedules are the default, and what changes when airflow follows a measured signal.
No BMS in your building? Here is what you can still automate
Schedules, thermostats, rooftop unit controls, demand ventilation and lighting sensors all work without a building management system. What each needs, and where a BMS is still needed.
Three signs your ventilation runs when nobody is there
Night power use the schedule does not explain, CO2 at the outdoor level while fans run, and rooms that look the same busy or empty. How to check each one.

What changes when ventilation follows occupancy
When airflow follows occupancy, fans slow down and rooms differ. What changes in airflow, energy, comfort and upkeep, with the evidence and its limits.
Spring ventilation: stop conditioning empty rooms
Mild weather and partial occupancy expose ventilation that runs on a fixed pattern. What to check on economizers, heating against cooling, and empty rooms.
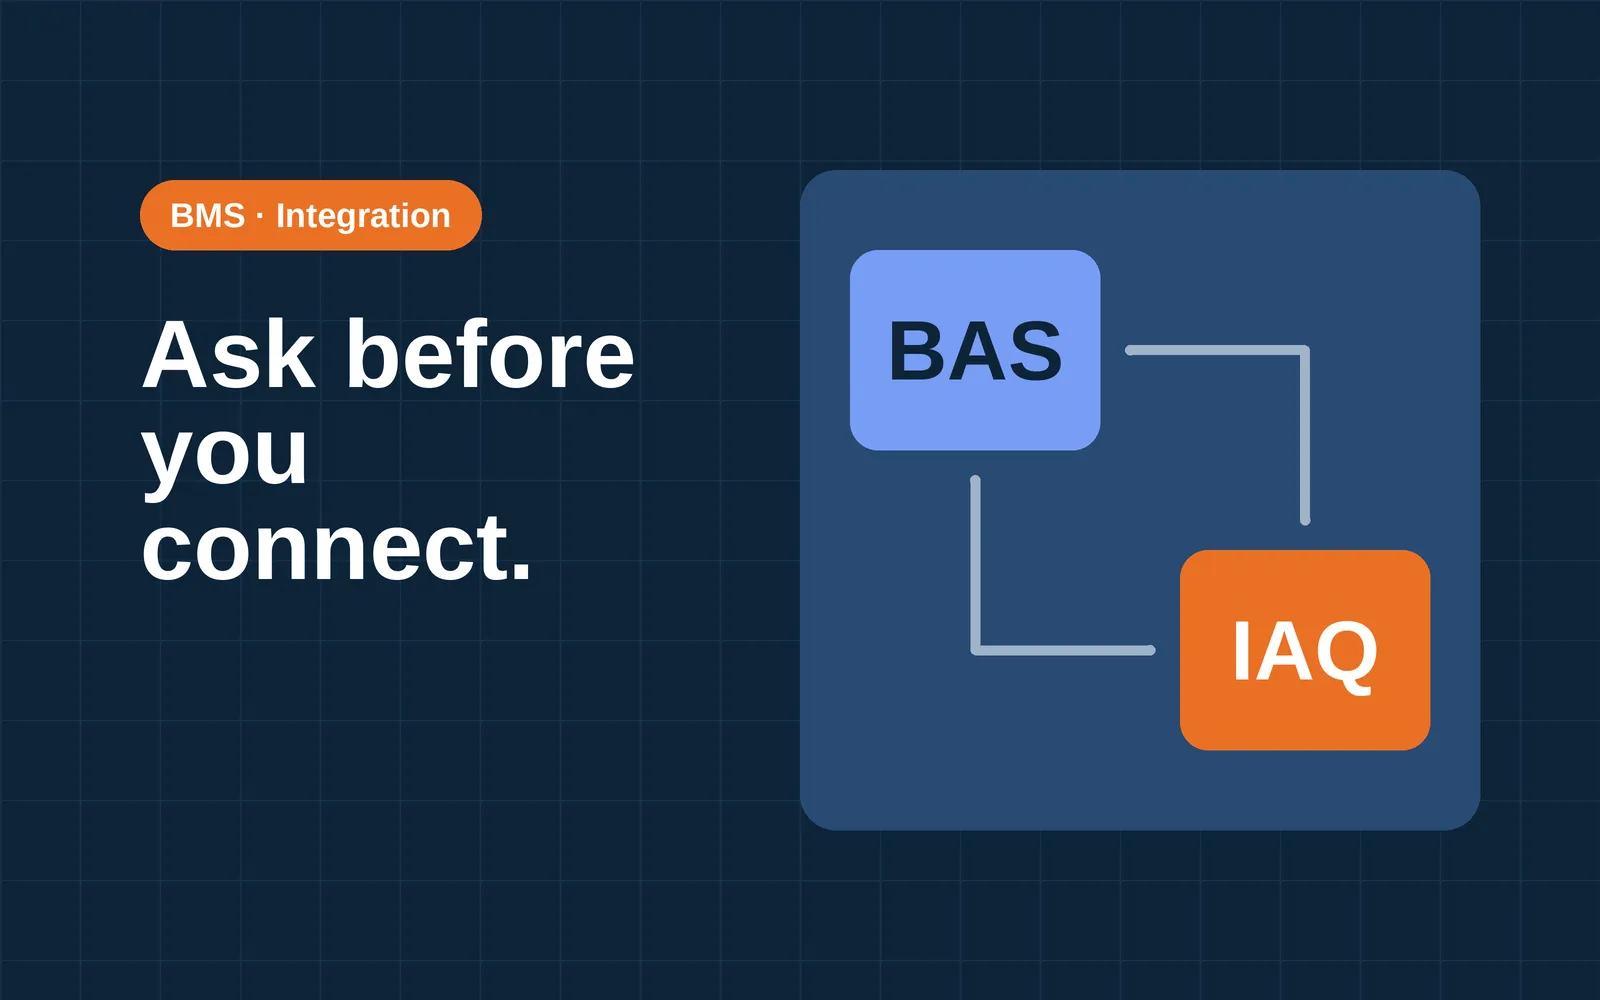
Connecting new sensors to an existing BMS: what to ask your vendor
Adding sensors to a BMS can involve licenses, labor and responsibility as well as hardware. Questions on protocols, points, data ownership, commissioning and cybersecurity.

What to ask before you buy a building automation system
Questions for the vendor before you sign: what the system controls, which EN ISO 52120-1 class it reaches, open protocols, who maintains it, who owns the data, security and commissioning.

Building automation in new developments: what to specify
What a developer or design team can write into the tender for building automation in a new building: EPBD functions, an EN ISO 52120-1 class, open protocols, commissioning and handover.
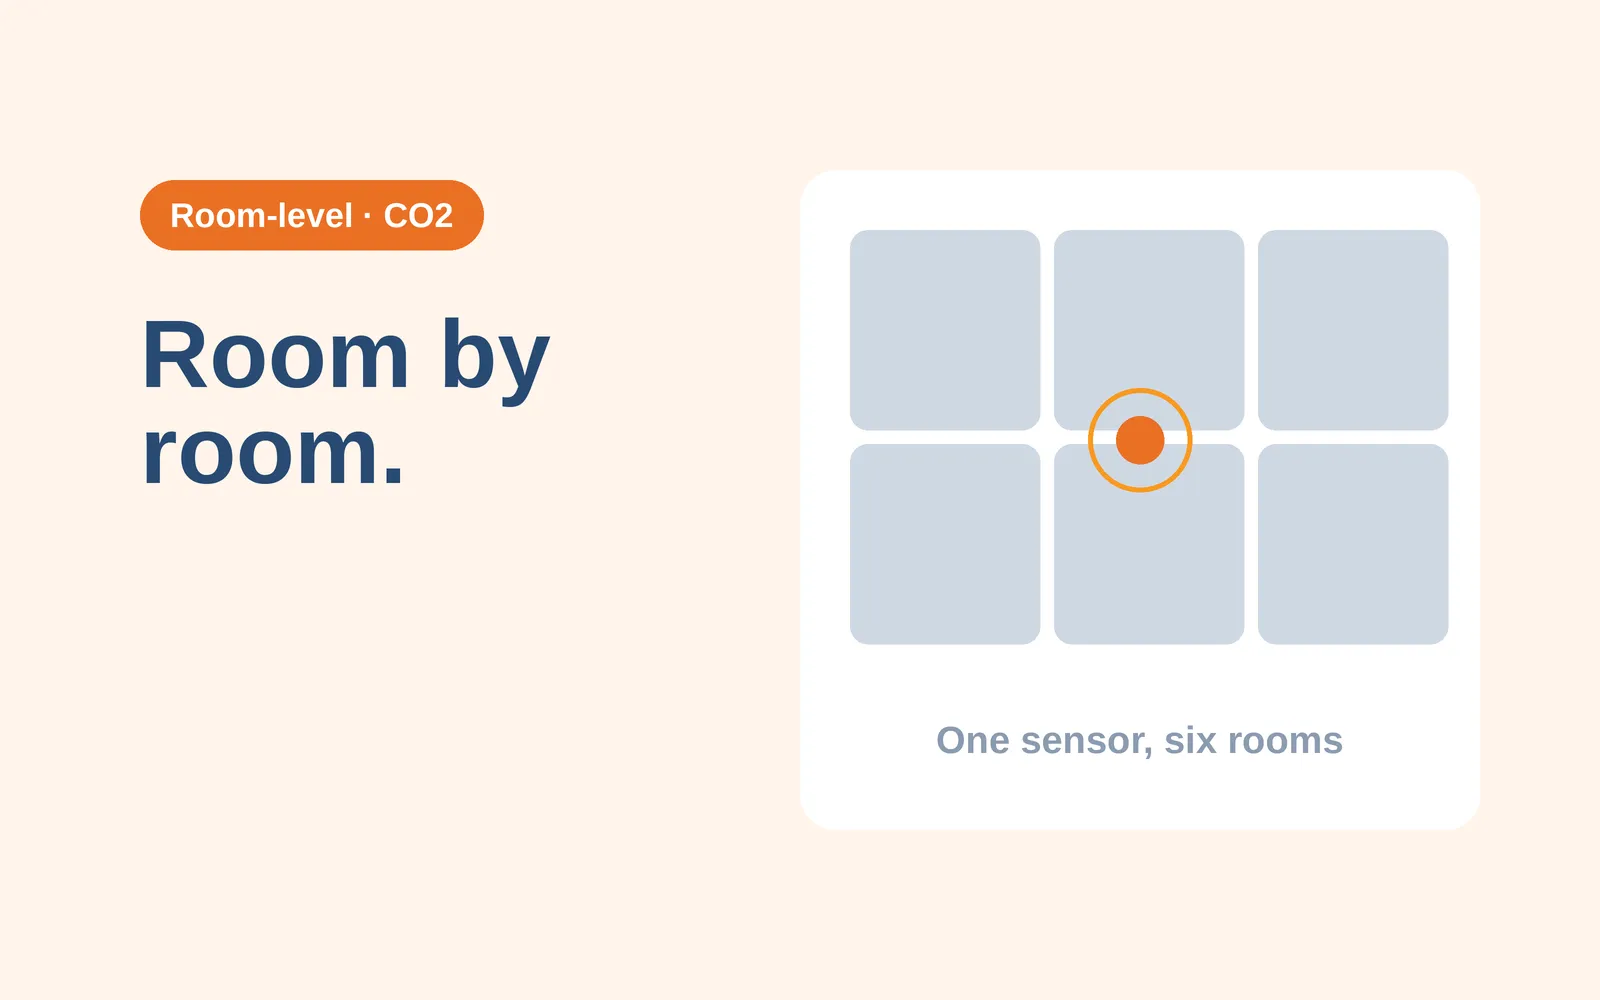
Why one CO2 sensor per floor misses the problem rooms
A CO2 sensor on a floor or in the return air reports an average of the rooms it serves. Field data from meeting rooms and classrooms shows how far one point can differ from another.

Five questions to ask before installing a CO2 monitor
What the reading is for, where the monitor goes, how accurate it is, how it is powered and who acts on it. Five questions for a CO2 monitor, with published guidance where it exists.
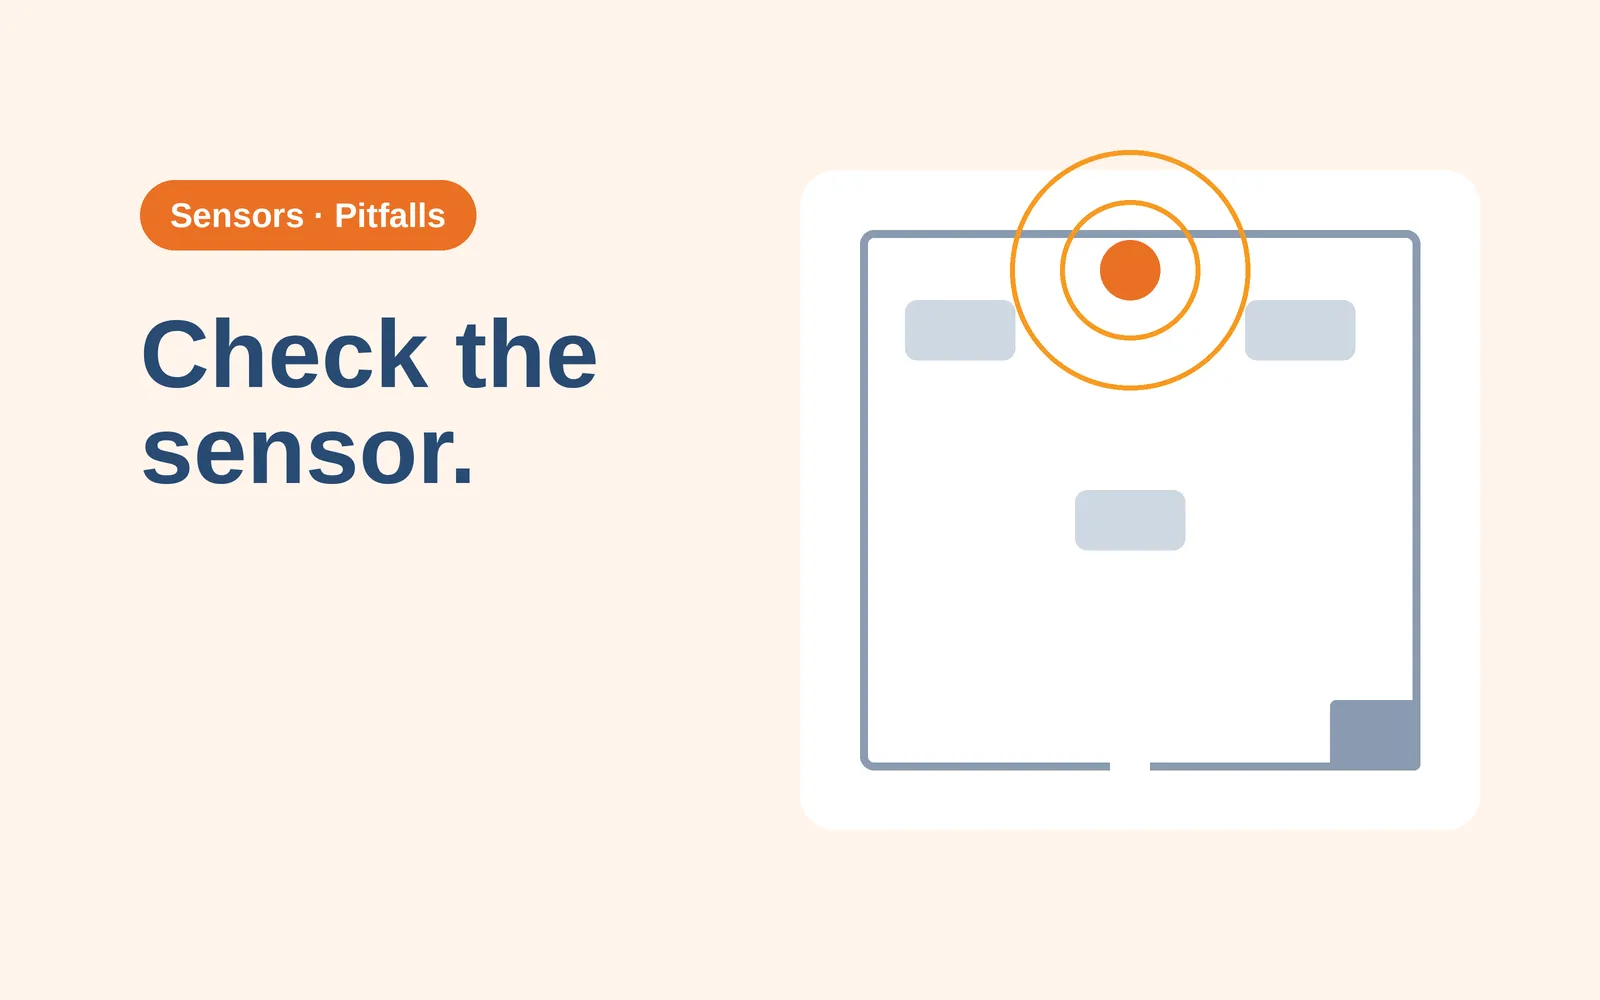
What facility managers get wrong about CO2 sensors
Five documented problems with CO2 sensors in buildings: unchecked accuracy, self-calibration limits, placement, single-number thresholds and treating CO2 as air quality.
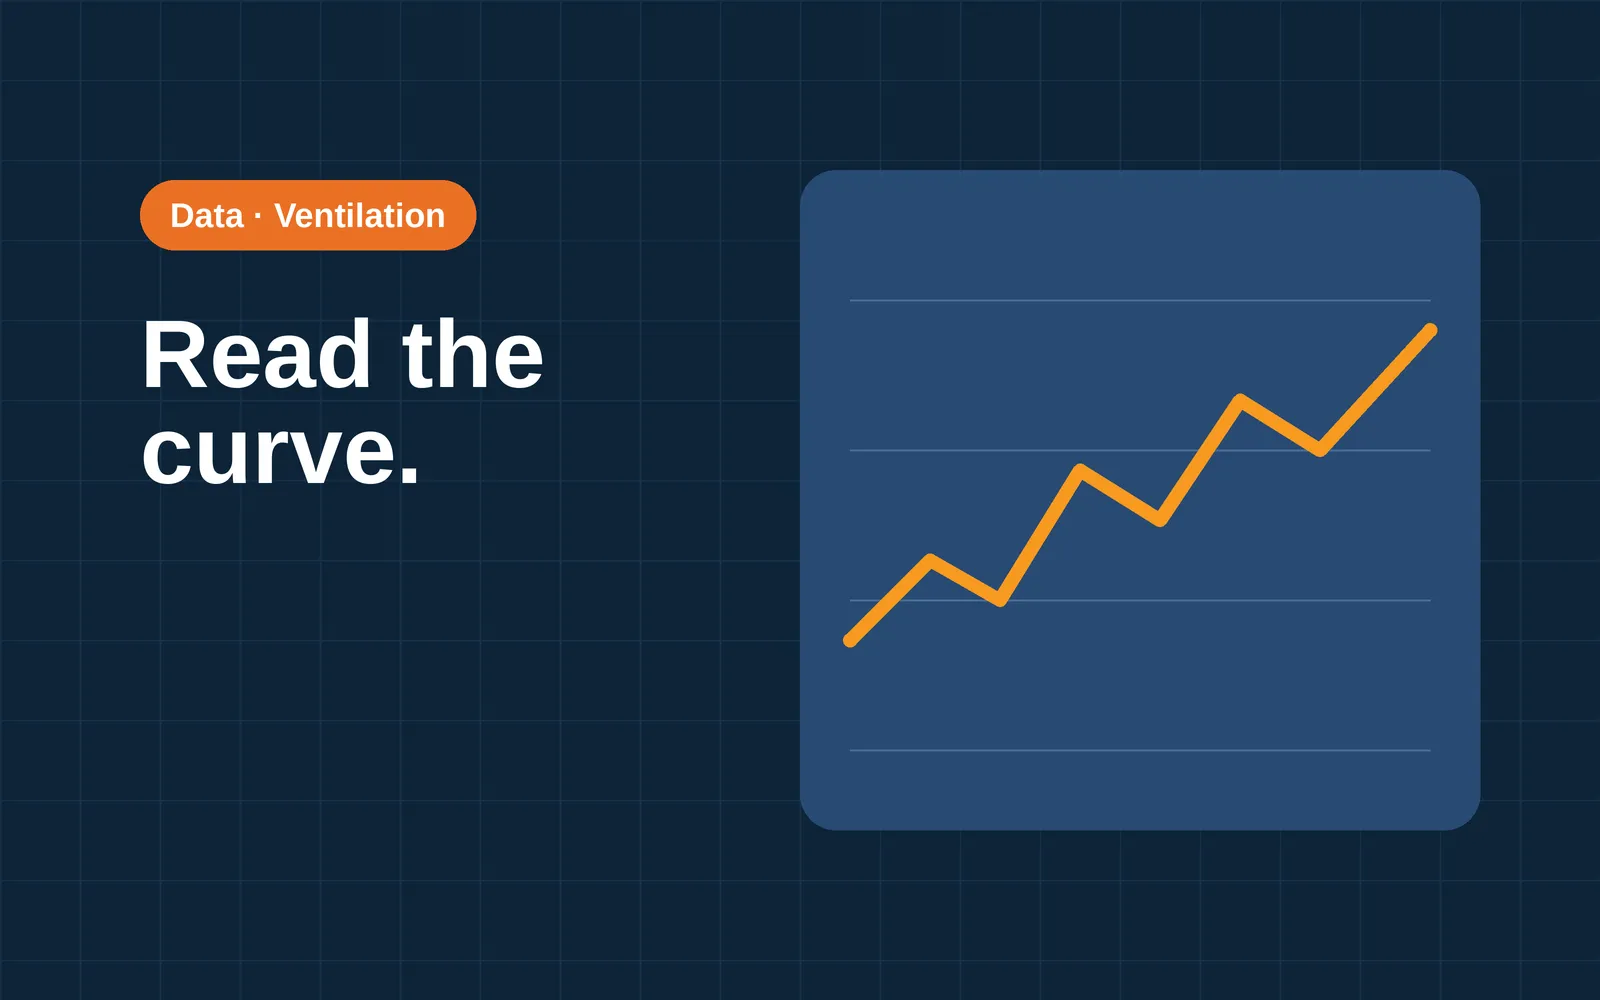
How to read ventilation data in five minutes
A routine for one day of CO2 data: overnight baseline, morning rise, peak, plateau and recovery, with temperature and humidity beside it. What each pattern can mean.

Room-level data: the missing layer in most buildings
Meters, plant controls and zone setpoints describe equipment. Room-level data shows what each room actually gets. Measurements in meeting rooms and classrooms found readings varying even inside one room.
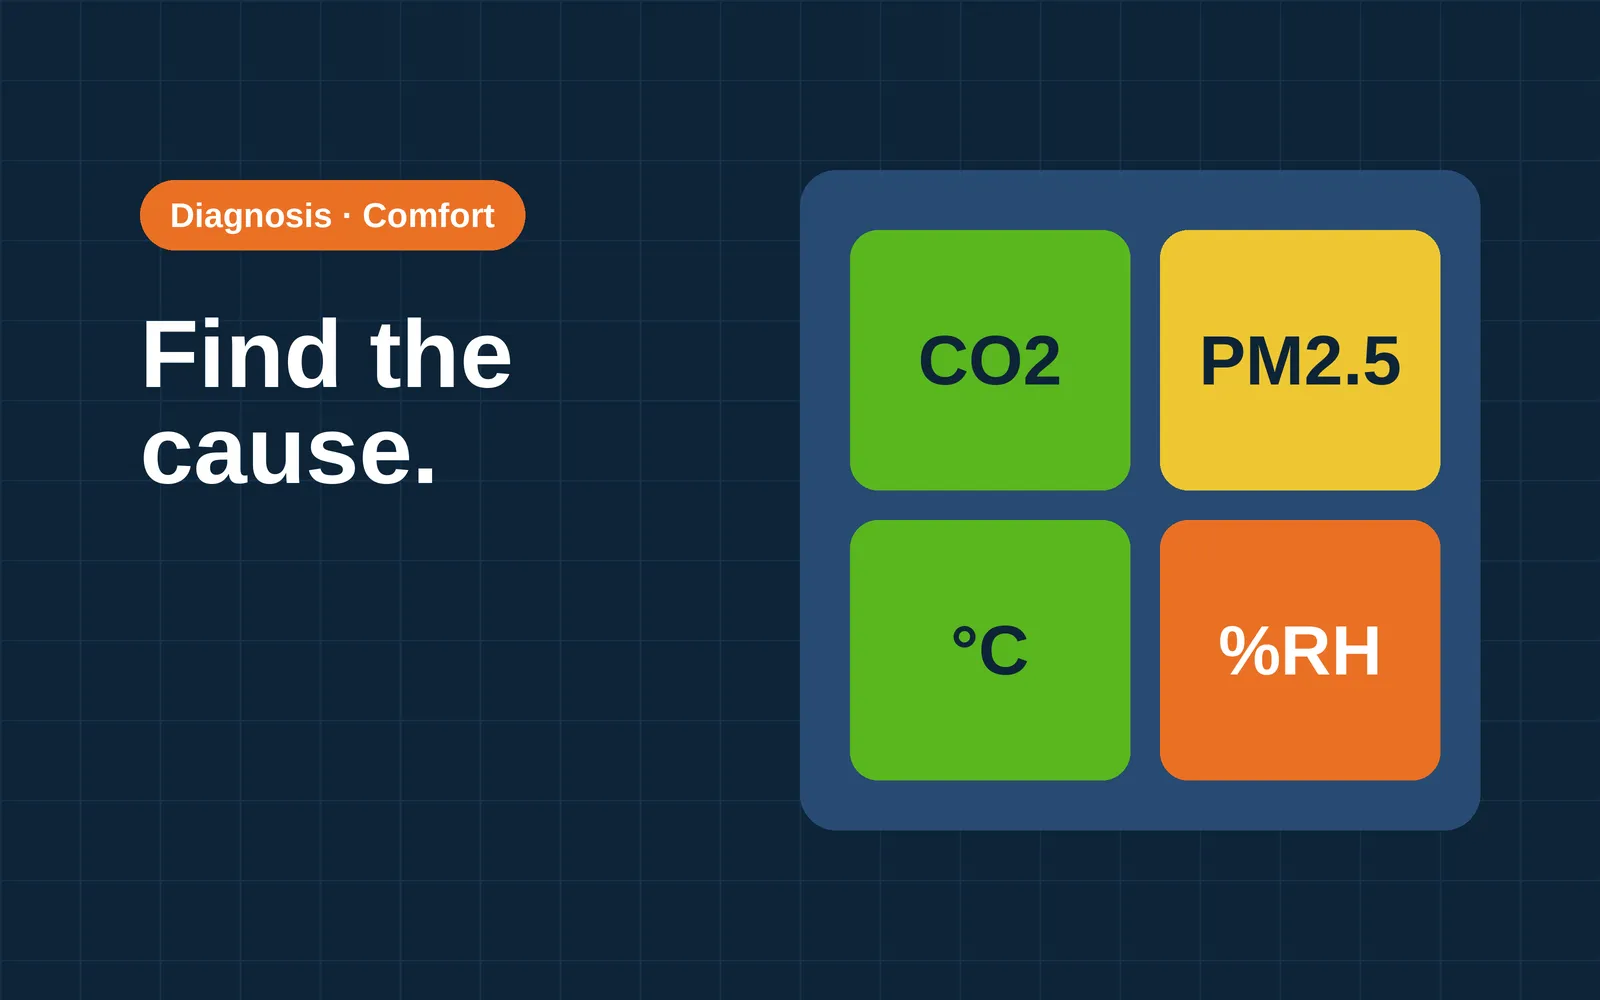
Too warm, too stuffy: how to find the cause room by room
Temperature, humidity and CO2 point to different causes. Published guidance and fault data point to where to look for each, and room readings narrow the search.

How to spot ventilation problems before tenants complain
Logged readings and a walk-round can show ventilation faults before a complaint arrives. Published fault studies report how common faults are in monitored buildings.
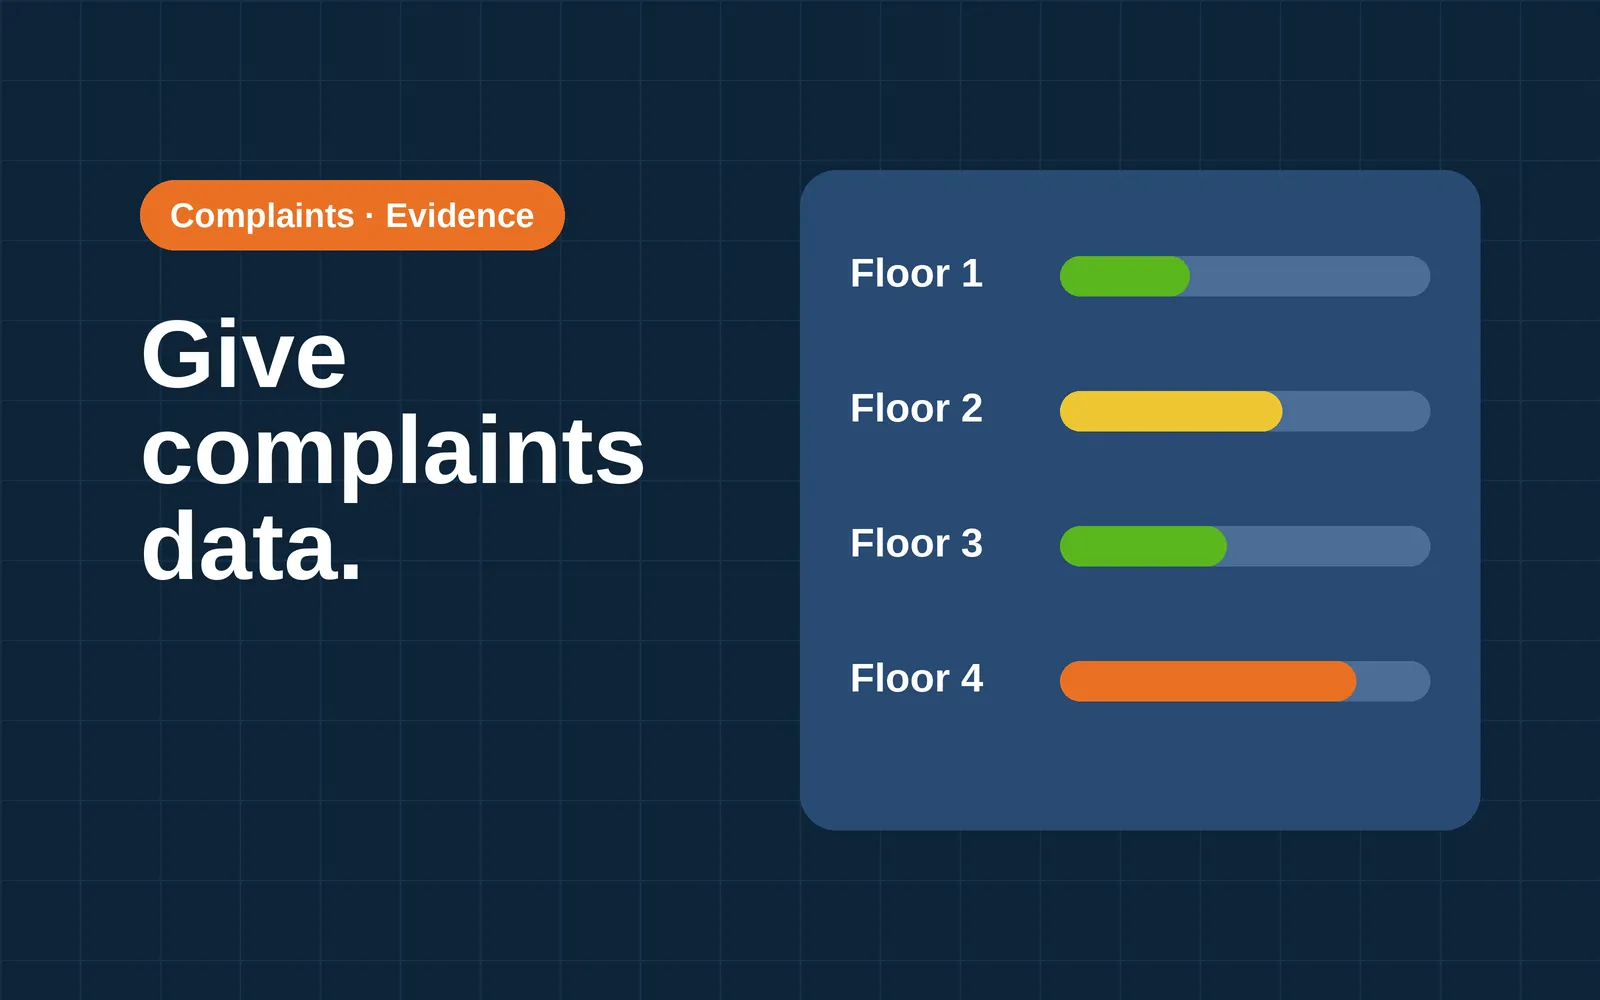
Building complaints are a data problem, not a people problem
Ventilation and temperature readings explain some indoor climate complaints. Other symptom reports track work stress and control over the room. What the research found, and how to triage.

The EPBD on one page: what building owners need to know
What Directive (EU) 2024/1275 says about building automation and indoor environmental quality in non-residential buildings, and what an owner should check first.
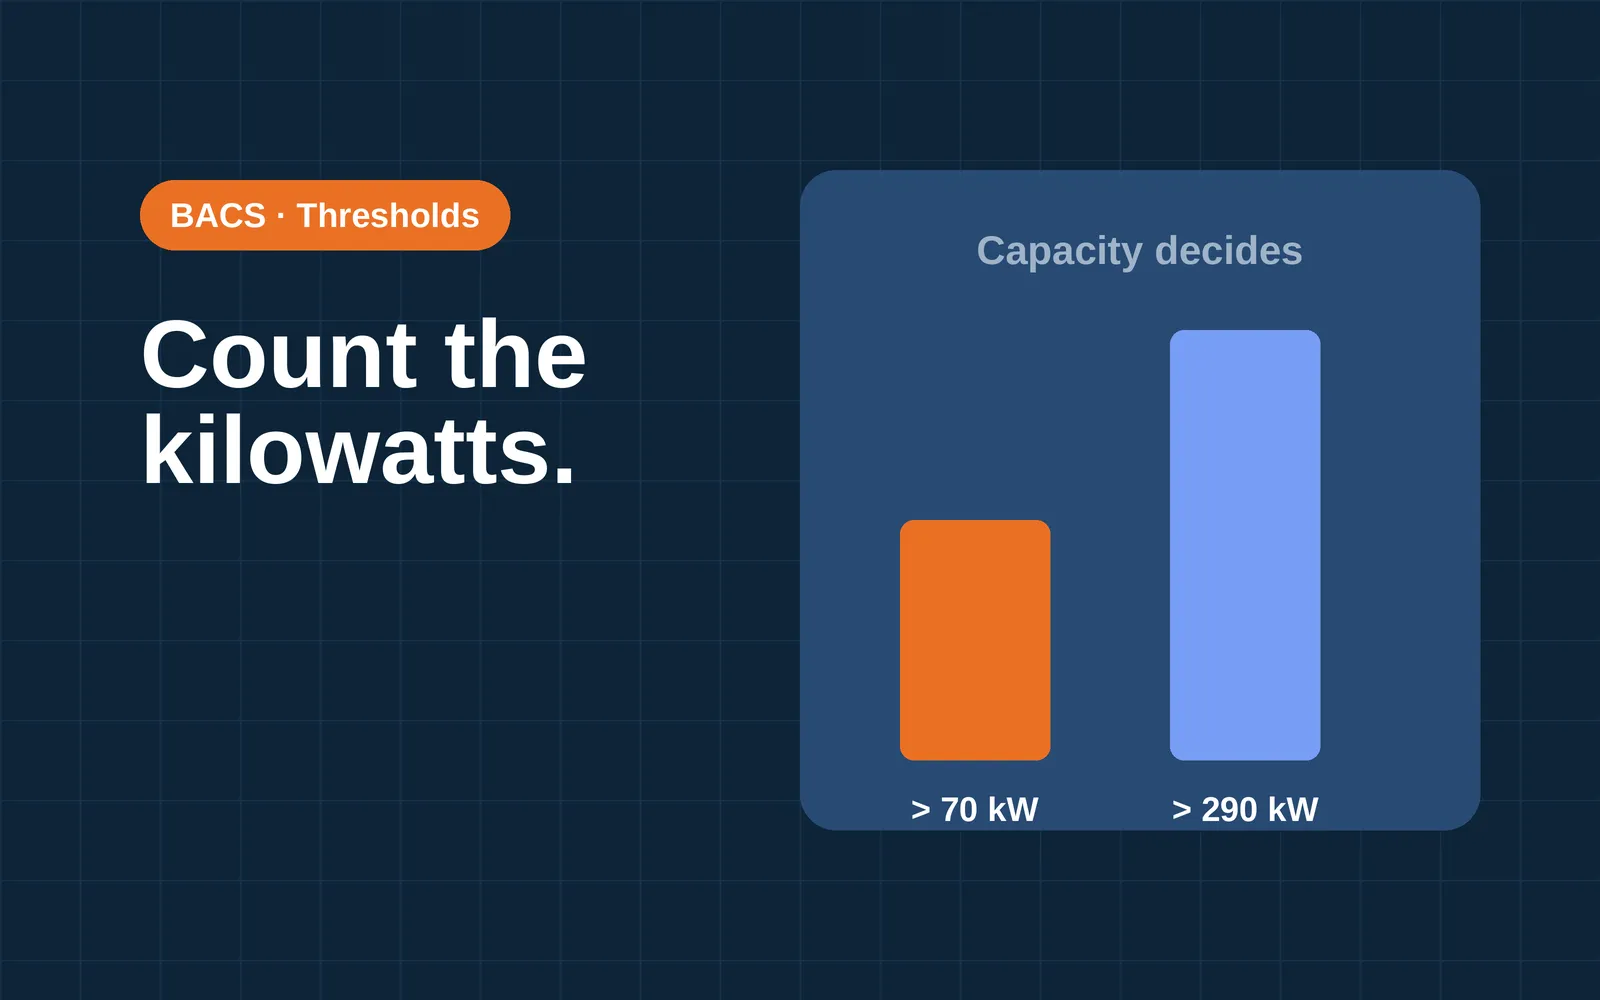
Does the 290 kW or 70 kW threshold apply to your building?
How the BACS thresholds of 290 kW and 70 kW are measured in the EPBD, how separate systems are added up, and where national texts count differently.

Future-proofing a building for the next regulation
The EPBD dates already set, two announced standards revisions, and practical steps for building automation that follow from rules already adopted.

Where to start with building automation compliance: a checklist for owners
An eight-step checklist for BACS compliance work: list the plant in kW, find the national rule, compare your controls with Article 13(10), and document it.

GACS in the Netherlands: what building owners need to know
Who must have a GACS (gebouwautomatiserings- en controlesysteem), from which kW and date, who enforces it, and where RVO and the housing ministry differ on indoor environment.

Germany's building automation rule now starts at 70 kW: what changed
Section 71a GEG (above 290 kW, end 2024) is repealed. Section 56 GModG covers Gebäudeautomation above 70 kW by end 2029. The functions, exemptions, in-force date and open points.

France's décret BACS: who is covered and when
France's décret BACS sets 290 kW and 70 kW tiers for tertiary buildings. Who is covered, which dates apply, who carries the duty, the exemption study and what the sources leave open.

Belgium and Austria: why the building automation rules depend on the region
BACS in Belgium differs across Flanders, Wallonia and Brussels, and BACS in Austria across states. What four Austrian states and the three Belgian regions say, and what is unchecked.
Reactive vs predictive HVAC maintenance: what room data changes
Reactive, preventive, condition-based and predictive maintenance defined from DOE and standards sources, what the evidence for HVAC shows, and what room-level data can and cannot add.
Facility management companies: how to prove HVAC performance to clients
Task lists show that work was done. Measurements show whether rooms were comfortable and ventilated. What evidence a client can accept, which standards help, and how to report it.

One view for many buildings: what portfolio owners need
Multi-site building monitoring works when every building is measured, named and reported the same way. What portfolio owners need: comparable metrics, naming, alerts, access control and reporting.
A simple weekly routine for reviewing building data
A 30-minute weekly routine for facility management teams: what to open, what to compare, what to log and when to escalate. A practical suggestion, not a published standard.
What energy consultants should ask about ventilation in an audit
A basic energy audit reads ventilation from utility bills and a brief survey. Questions on measured airflow, schedules, controls, filters, heat recovery and CO2 data, tied to EN 16247 and the ASHRAE audit levels.

How to verify ventilation savings with before and after sensor data
Savings verification compares energy use before and after a ventilation change, adjusted for weather and occupancy. IPMVP options, baseline length and the sensor pitfalls that distort the comparison.
Where ventilation wastes energy: what to check first
Seven places where ventilation wastes energy, in the order that is cheapest to check: operating hours, airflow settings, simultaneous heating and cooling, economizers, filters, ducts and heat recovery.
Improving ventilation without replacing your HVAC: what is possible
An HVAC retrofit that keeps the plant can fix schedules, airflow settings and controls. Filters and heat recovery are limited by the fans and ducts already installed. What the sources say.

ESG reporting for buildings: what data you actually need
ESG reporting for buildings comes down to metered energy, floor area and emission factors. What ESRS E1, the EU taxonomy, GRESB and CRREM ask for, and where indoor data fits.

Net zero buildings still need clean air: how to do both
Tight, low-energy buildings only get fresh air from their ventilation system. What the EPBD says, what field studies measured, and how to cut energy without cutting air.
Why a good energy label does not tell you how well a building runs
An energy label built on calculation describes typical use. Measured use can differ by a wide margin. What performance gap research and operational ratings show.

Why one building is enough to start
Start with one building and let its measured results decide the rollout. How to choose it, what to measure and when to scale, with DOE and REHVA guidance cited and the practice labeled.
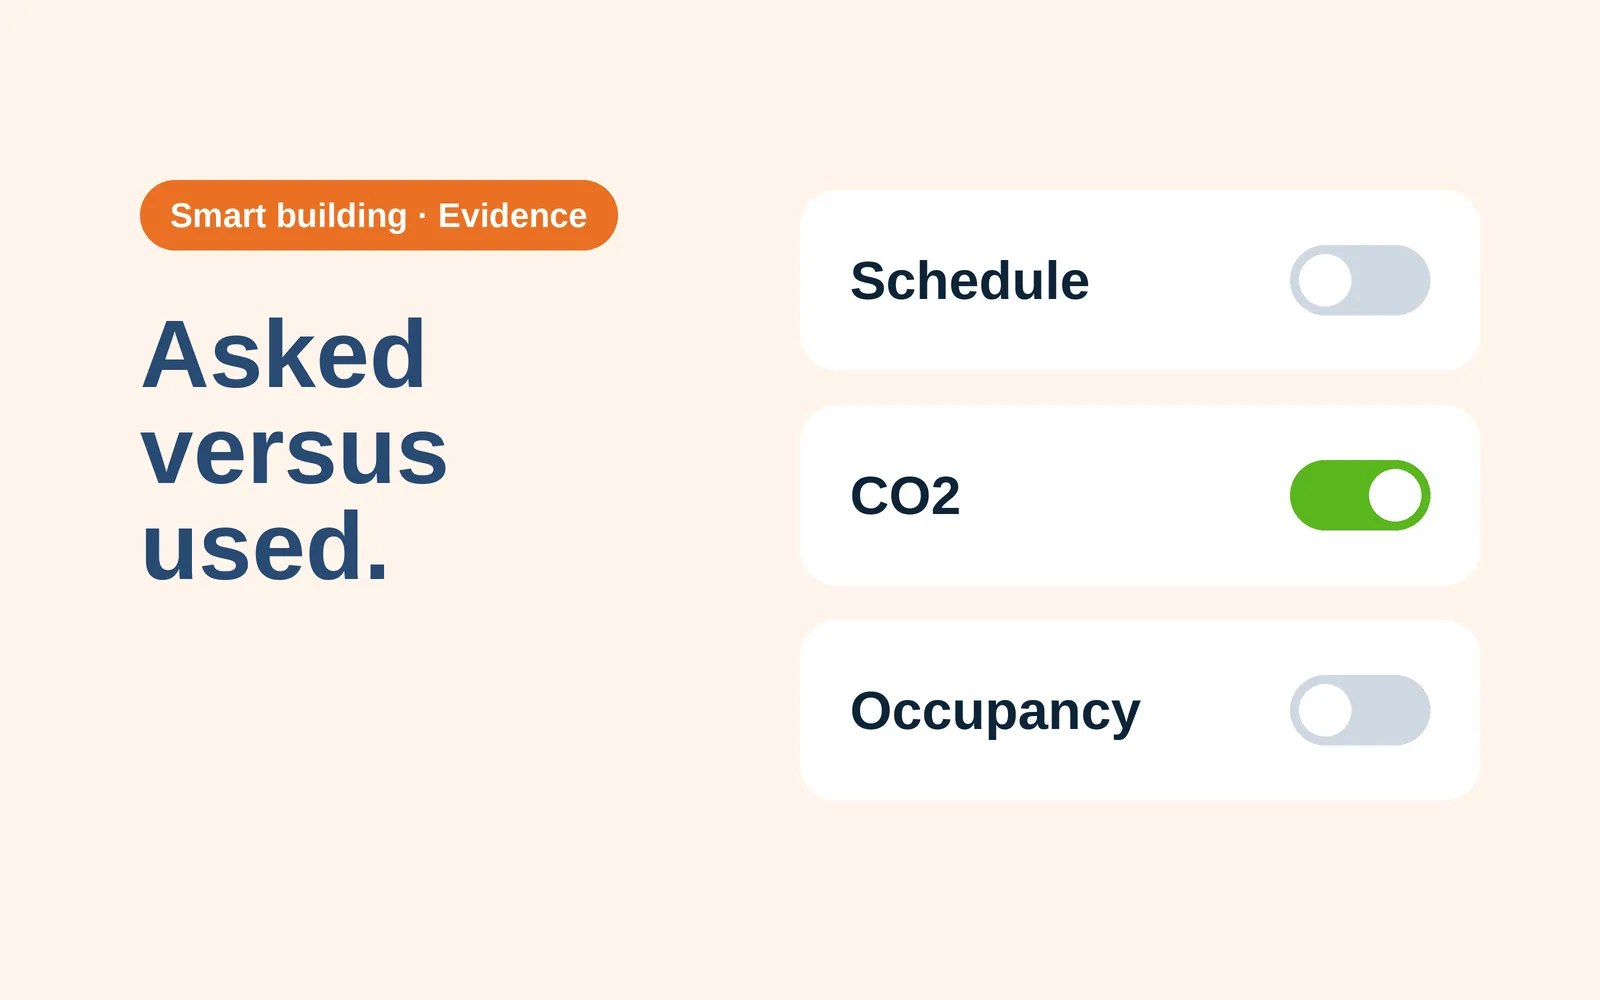
Which smart building features do tenants actually use?
Surveys show what tenants say they want in a smart building. Logged data shows what they use. The two differ, and most of the evidence comes from landlords and vendors.

Design for operations: how developers hand over better buildings
Soft Landings, commissioning and seasonal checks ask developers to involve operators early and stay on after handover. What each guide asks for, and how strong the evidence is.

Handover data: what operators wish developers provided
What handover guidance and case studies name: asset registers, control descriptions, point lists, commissioning records, O&M manuals. No survey of operators backs the title.
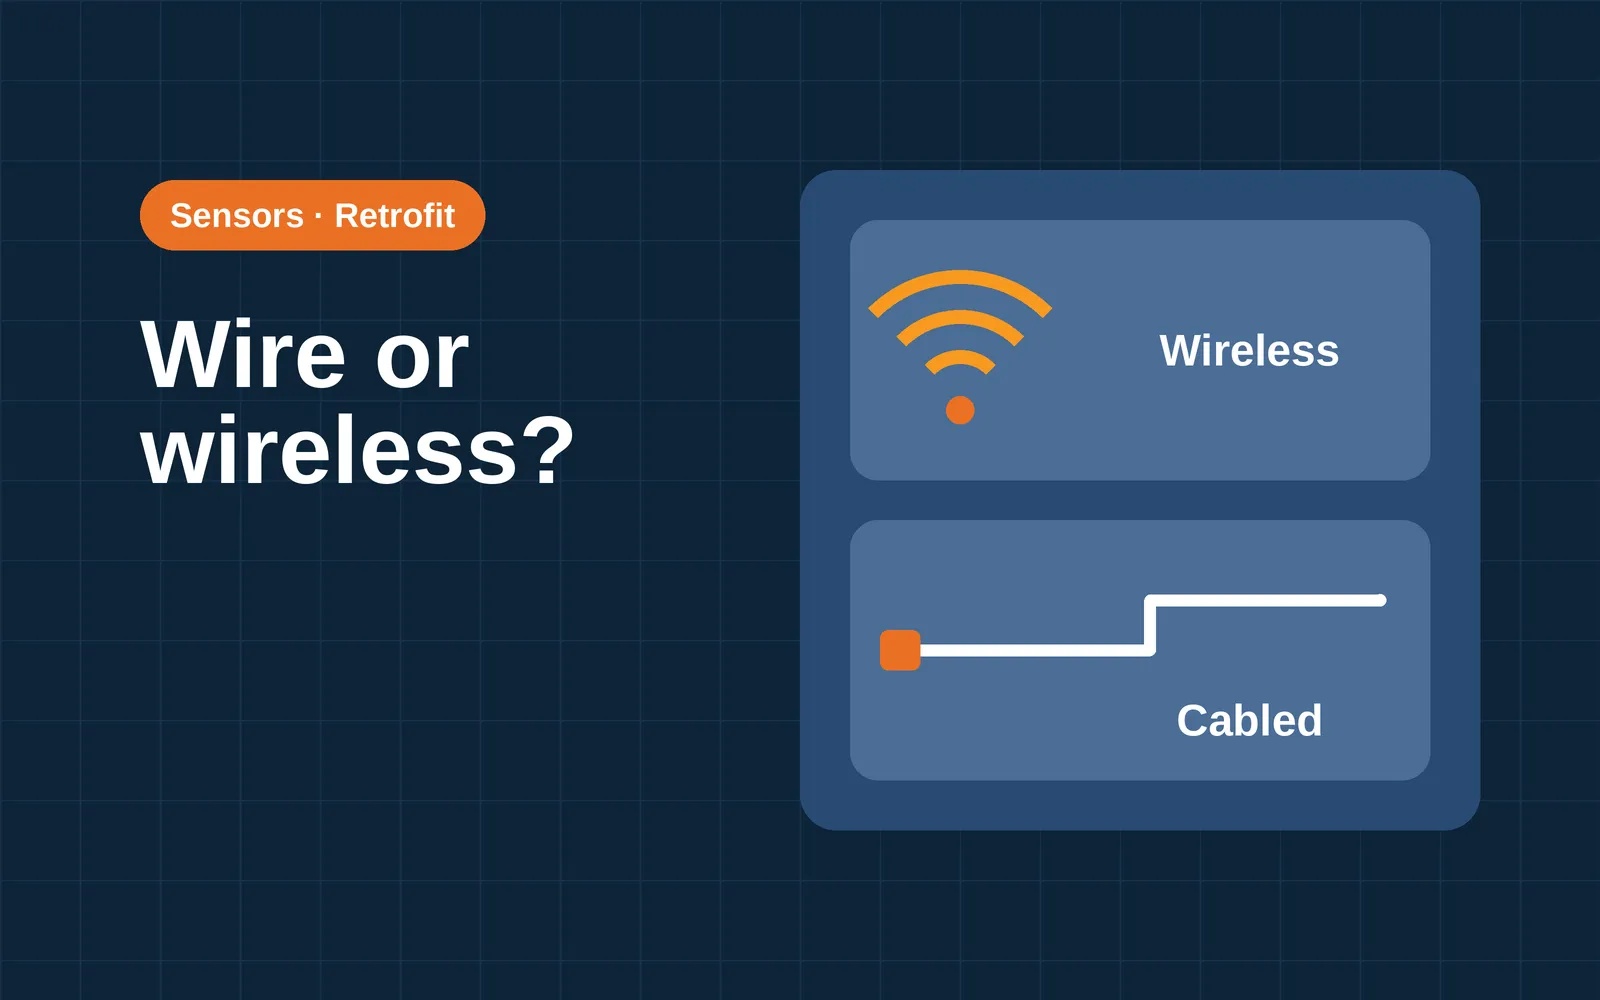
Wireless sensors vs cabled systems in fit-outs and retrofits
Wireless sensors and cabled systems trade batteries, radio range, interference and security against cable runs. What named sources say, and where they give no cost figures.
Indoor air quality and tenant satisfaction: what developers should measure
Office surveys do not rank air quality first, and in one two-office study satisfaction and CO2 readings tracked each other only loosely. What the studies found and what a developer can measure after handover.

Is your ventilation ready for summer overheating?
Outdoor air cools a room only while it is cooler than the room. What CIBSE TM52, TM59 and EN 16798-1 cover, how night cooling behaves, and what to check before the first hot week.

Ten questions building owners ask about ventilation control
Sensors, energy, air quality, cost, setup time, overrides and the law: ten questions about ventilation control, each answered from a named standard or study, or marked as practice.
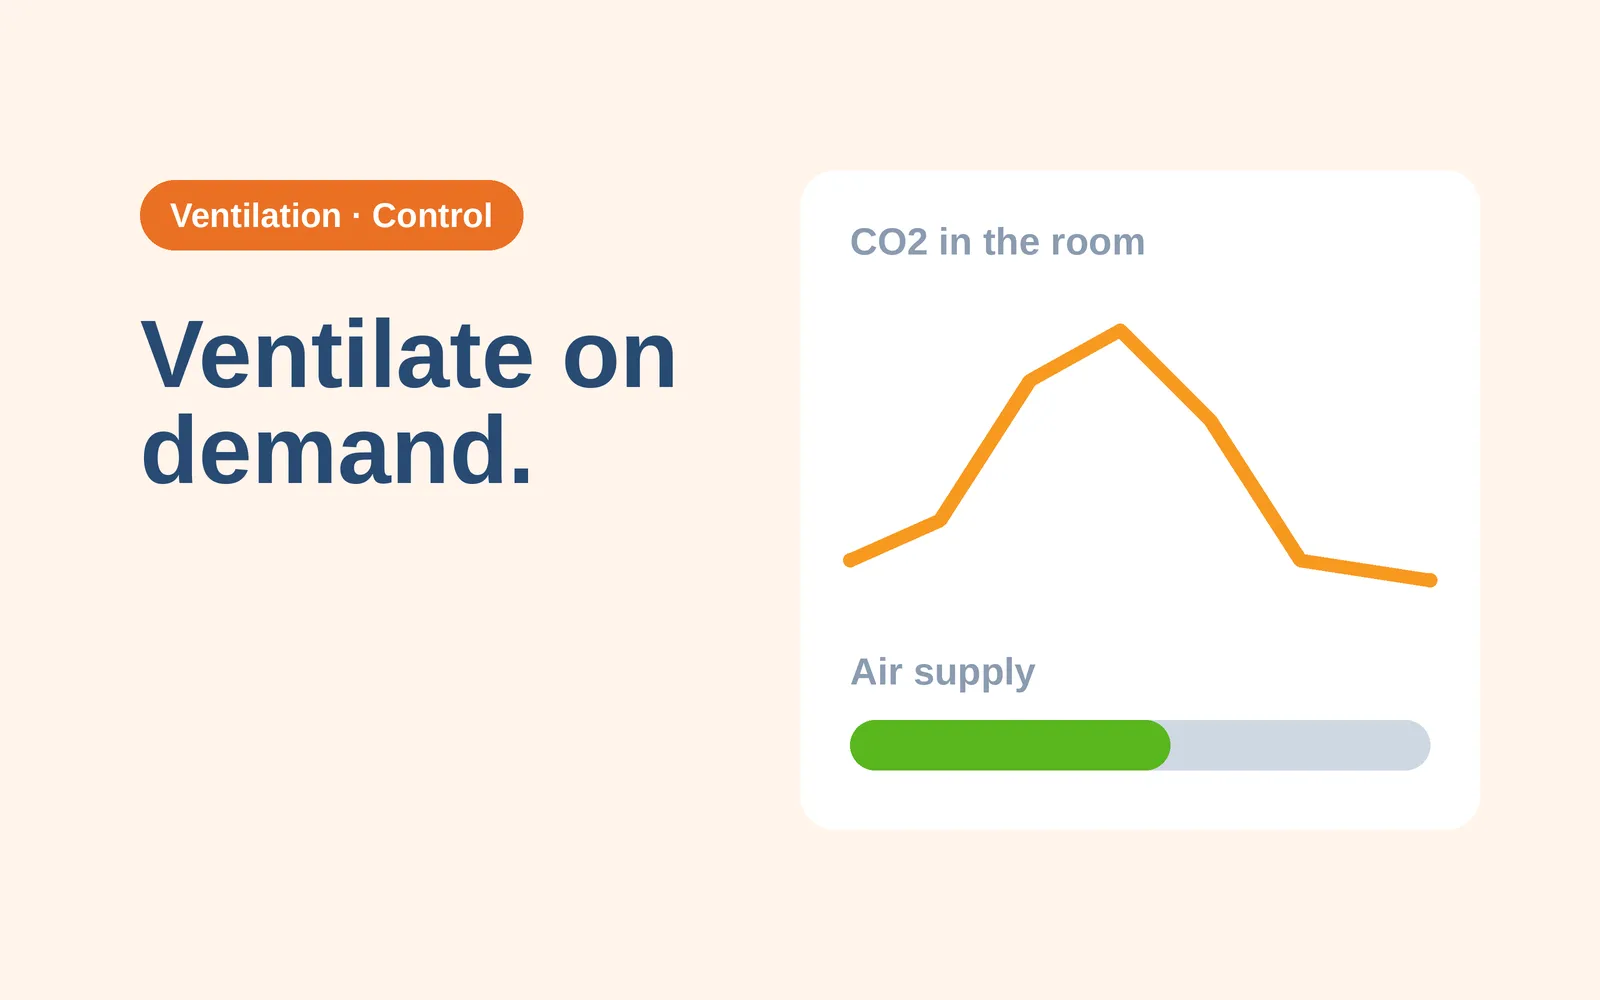
Demand-controlled ventilation for commercial buildings
Demand-controlled ventilation matches outdoor air to the people actually in a room. How CO2, occupancy and schedule signals differ, what the standards say and what savings studies found.
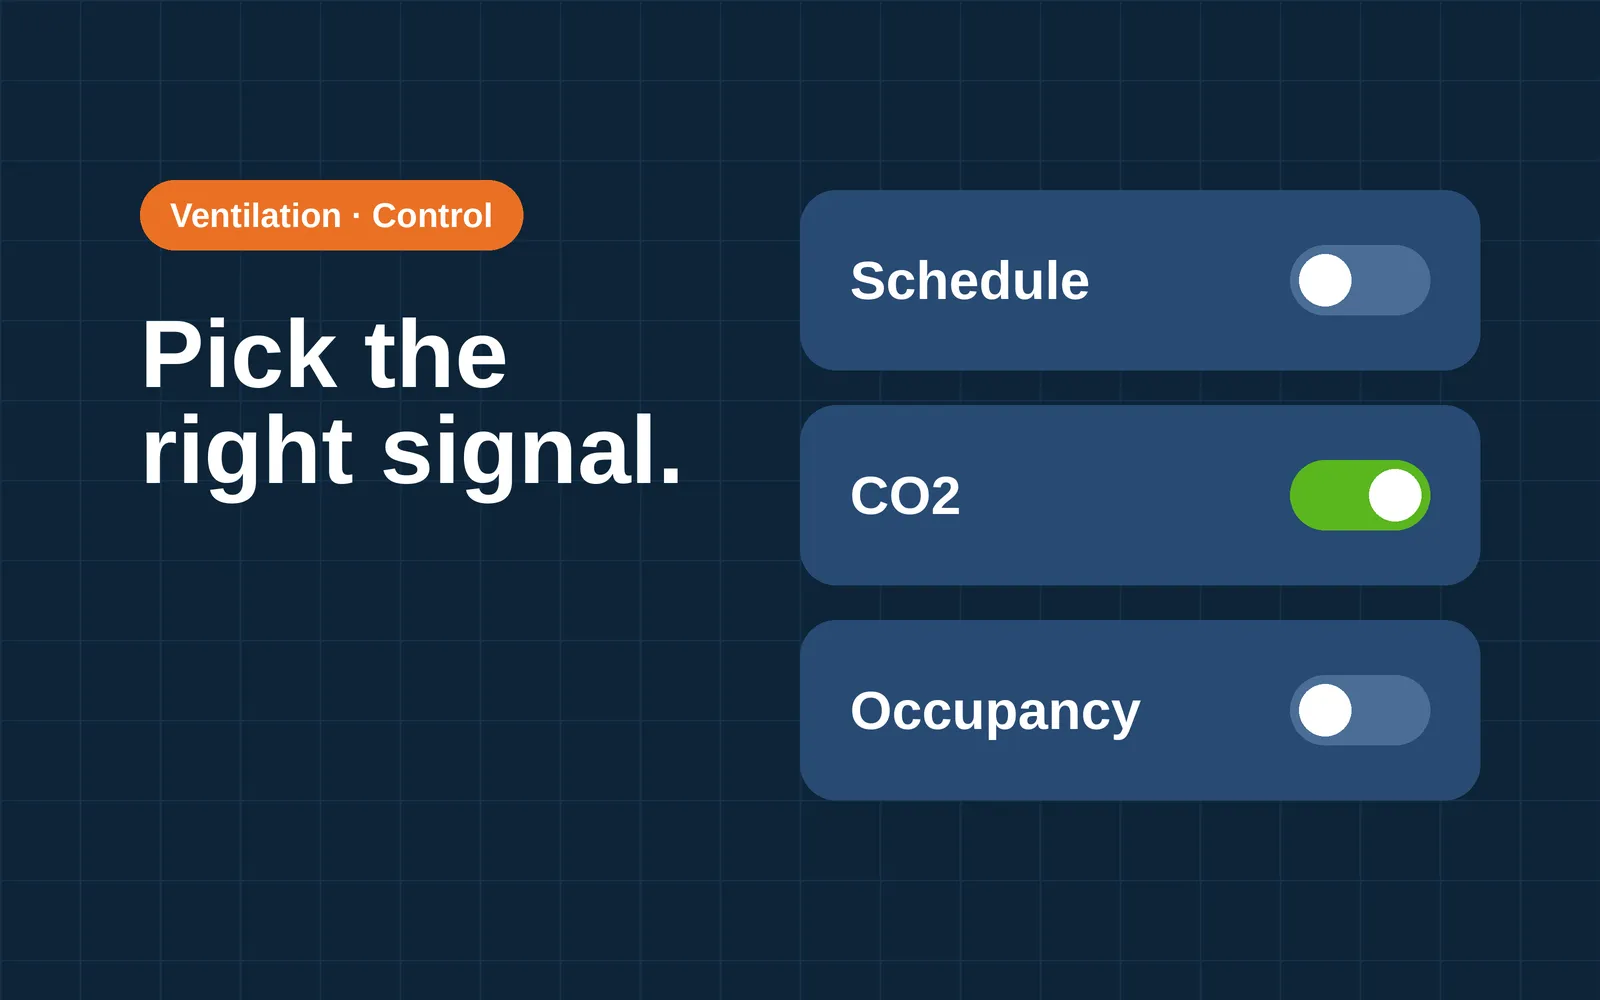
Ventilation control in commercial buildings: schedule, CO2 or occupancy
Schedule, CO2 and occupancy signals each have a blind spot. What the research and the standards say about each, and which rooms suit which method.
Adding demand-controlled ventilation to a building without a BMS
Demand-controlled ventilation does not always need a retrofit BMS. What the ventilation unit must be able to do, and what sensors, controls and commissioning involve.
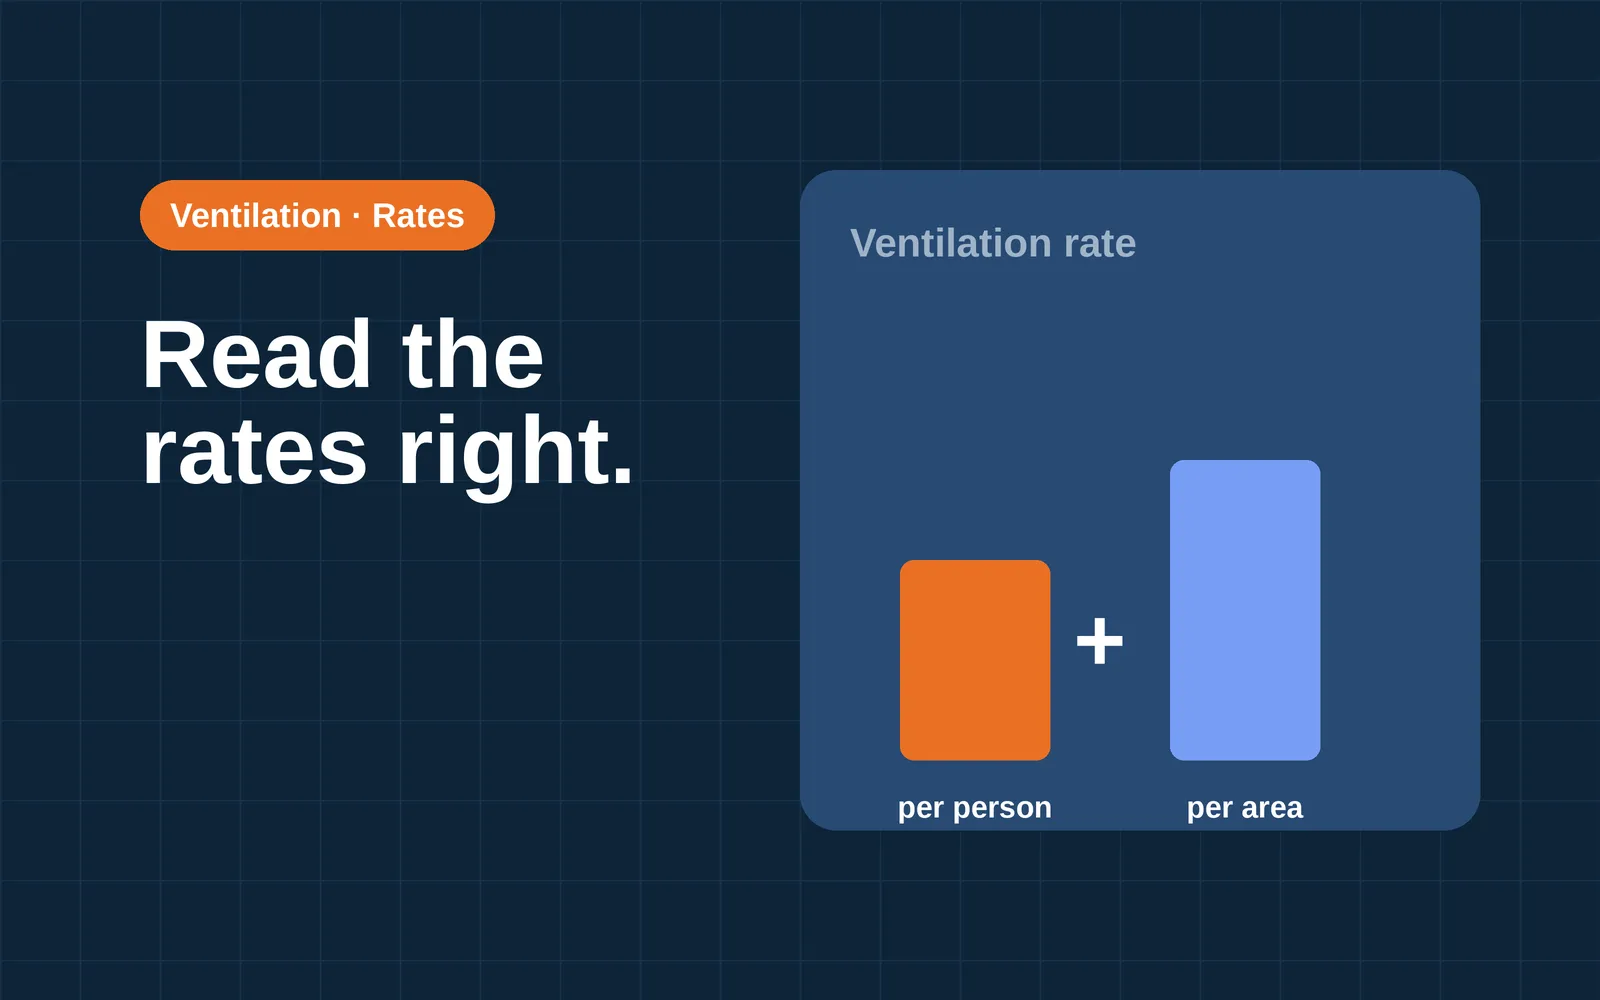
Ventilation rates in offices and classrooms: what the numbers mean
ASHRAE 62.1 and EN 16798-1 both write ventilation rates as a per-person part plus a per-area part. What the office and classroom numbers are, and why they differ between standards.
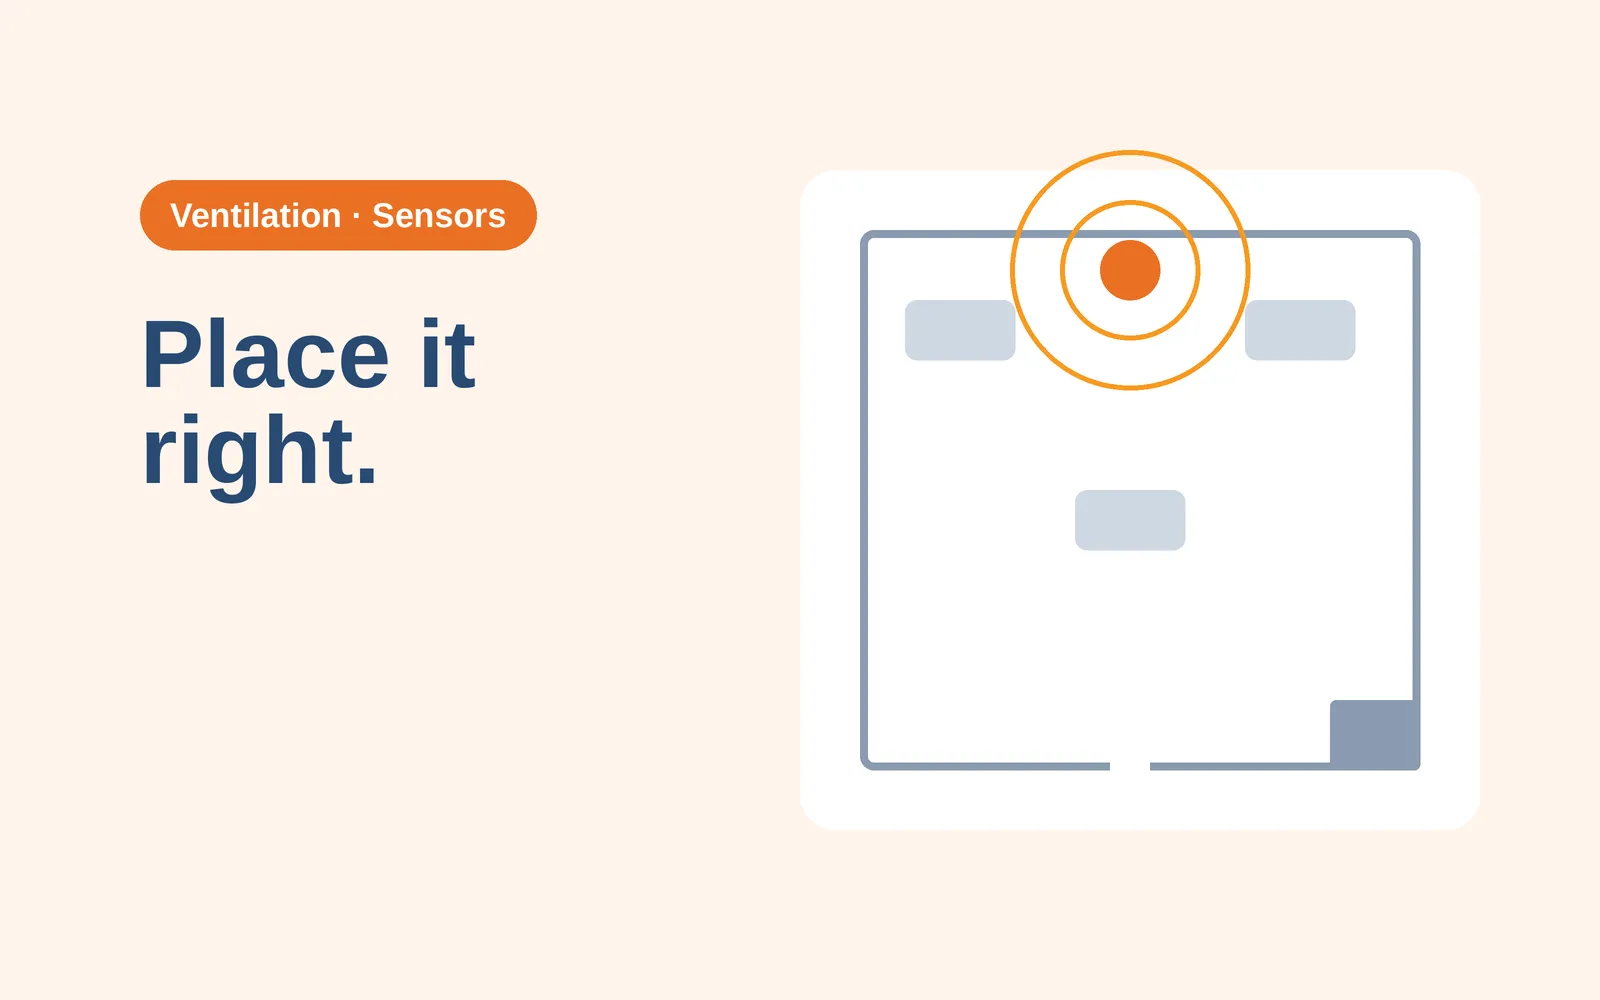
Where to place CO2 sensors for ventilation control
Height, distance from people, doors and supply air, and the outdoor reference: where guidance and field data put a CO2 sensor for ventilation control.
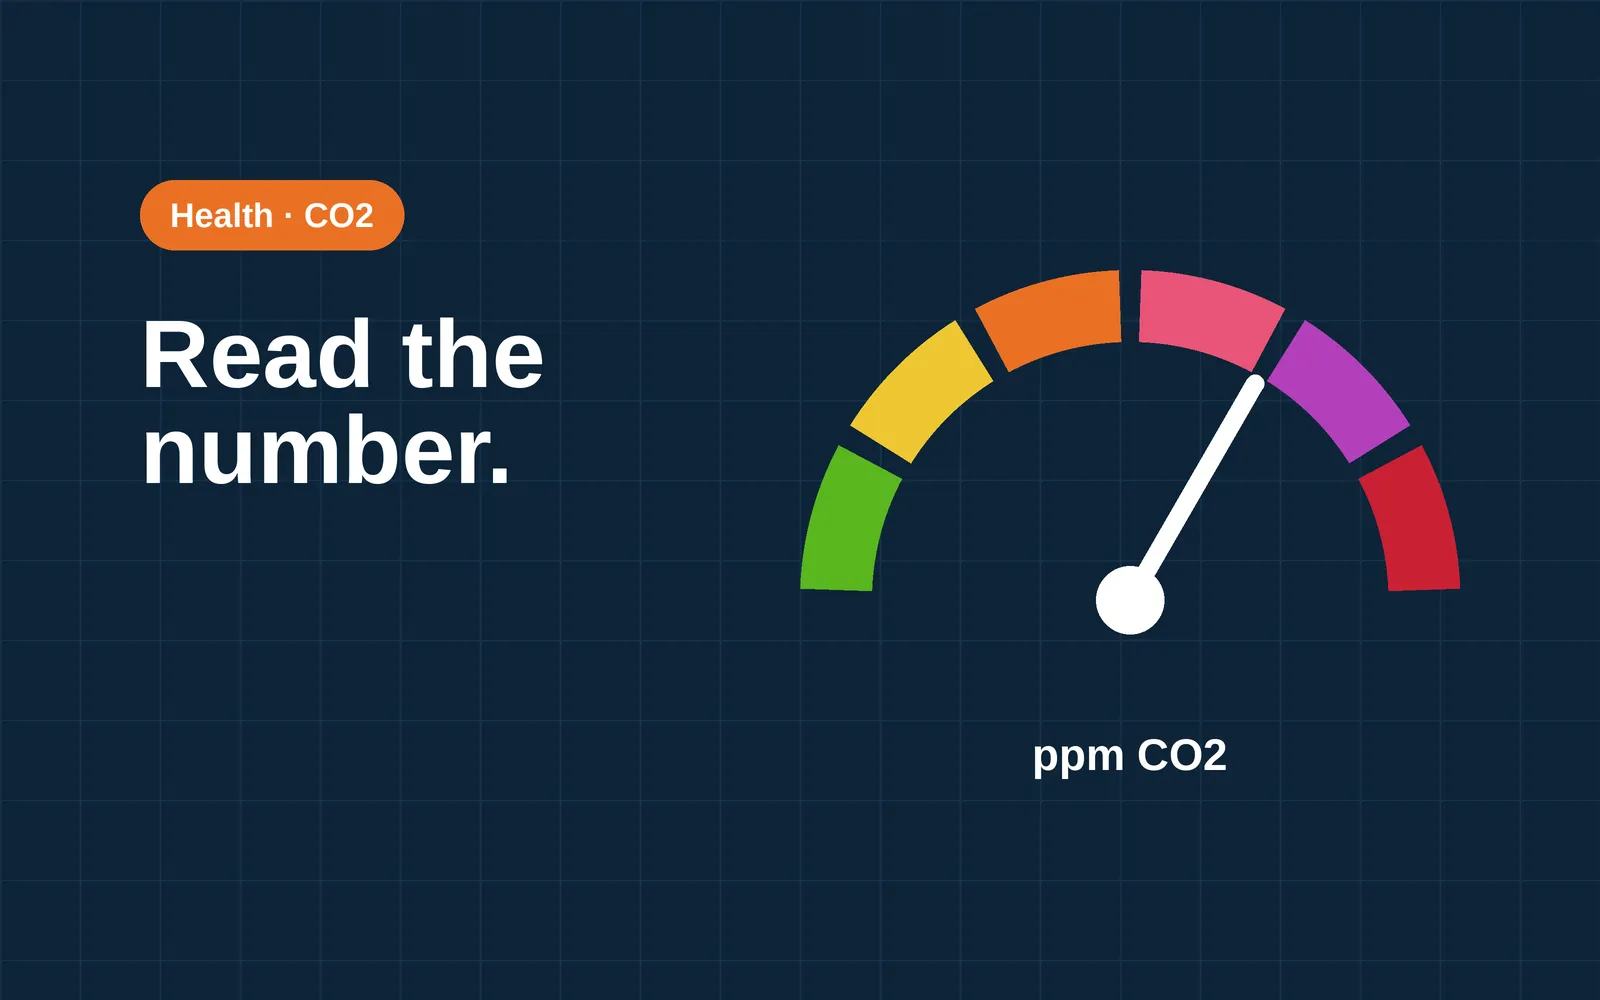
What is a good CO2 level in an office?
Germany's workplace rule uses 1,000 ppm. Where that number comes from, what EN 16798-1, German and UK guidance say, and what studies found on CO2 and thinking.

EPBD for non-residential buildings: what applies in NL, DE, FR, BE, AT and IE
One EU directive, different national rules. What the EPBD means for non-residential buildings in the Netherlands, Germany, France, Belgium, Austria and Ireland: kW thresholds, dates and open questions.
EPBD indoor environmental quality monitoring: what the May 2026 date means
Article 13 says building automation systems must be able to monitor indoor environmental quality by 29 May 2026. Who that covers, how it reaches buildings, and what the text leaves open.
Indoor air quality in offices, how to measure it
An office has no single air quality number. What to measure (CO2, temperature, humidity, particles, TVOC), which source gives each reference value, and what low-cost sensors can tell you.
CO2 monitor or air quality monitor: what a commercial building needs
A CO2 monitor shows whether a room gets enough fresh air for the people in it. An air quality monitor adds particles, chemicals, comfort and noise. Which one fits which question.

WELL Building Standard and air quality: what monitoring can show
WELL v2 sets CO2 and PM2.5 thresholds across several Air features and has one feature for monitoring and awareness. What the text requires, and what monitoring data can and cannot show.

How many CO2 sensors does a building need?
No standard sets one CO2 sensor count for a whole building. What California's rule, UK school guidance and field data show, and how to work out the number for your rooms.

Wireless CO2 sensors for retrofit buildings
A wireless CO2 sensor goes into an existing room without new cabling. What to check on radio options, battery life and the reporting interval, signal range in old buildings and security.

What is a building management system, and do you need one?
A building management system monitors and controls HVAC and other equipment from one place. What it does, what the EU rules ask for, and when a smaller setup is enough.
Building automation for buildings without a BMS
What building automation and control (BACS) means, what the EU directive asks of non-residential buildings in general terms, and the options when a building has no BMS.
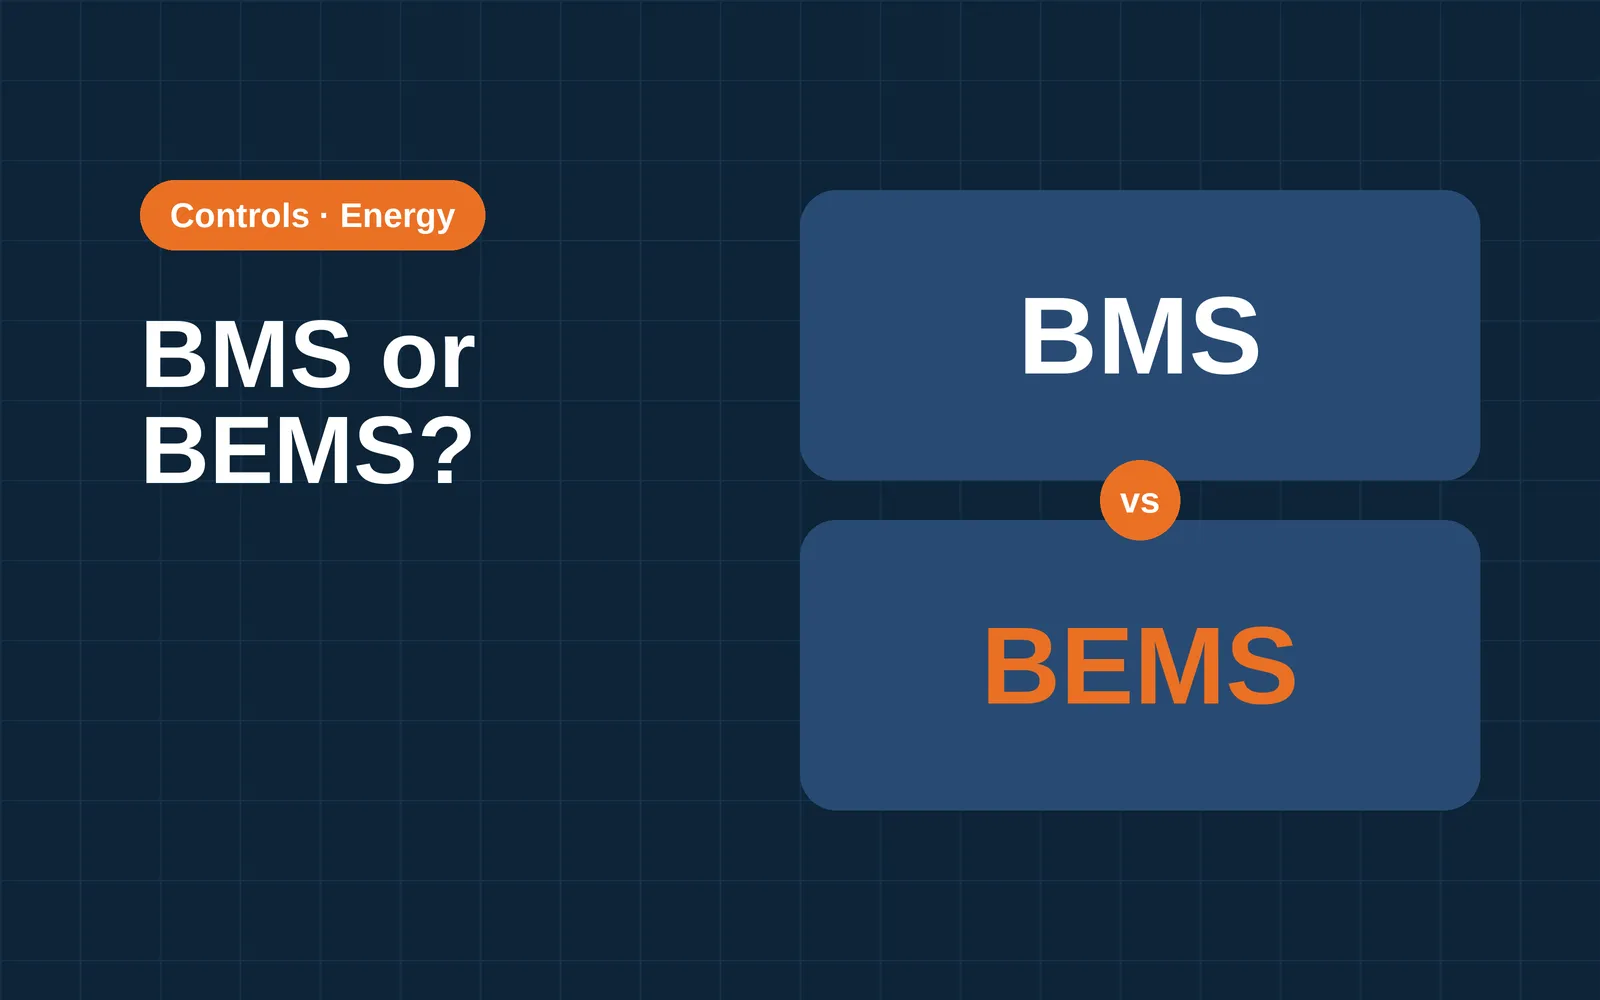
BEMS vs BMS: what is the difference?
Sources use BEMS, BMS and BAS for overlapping systems. What the terms mean, where they differ, and what a BMS alternative can and cannot do.
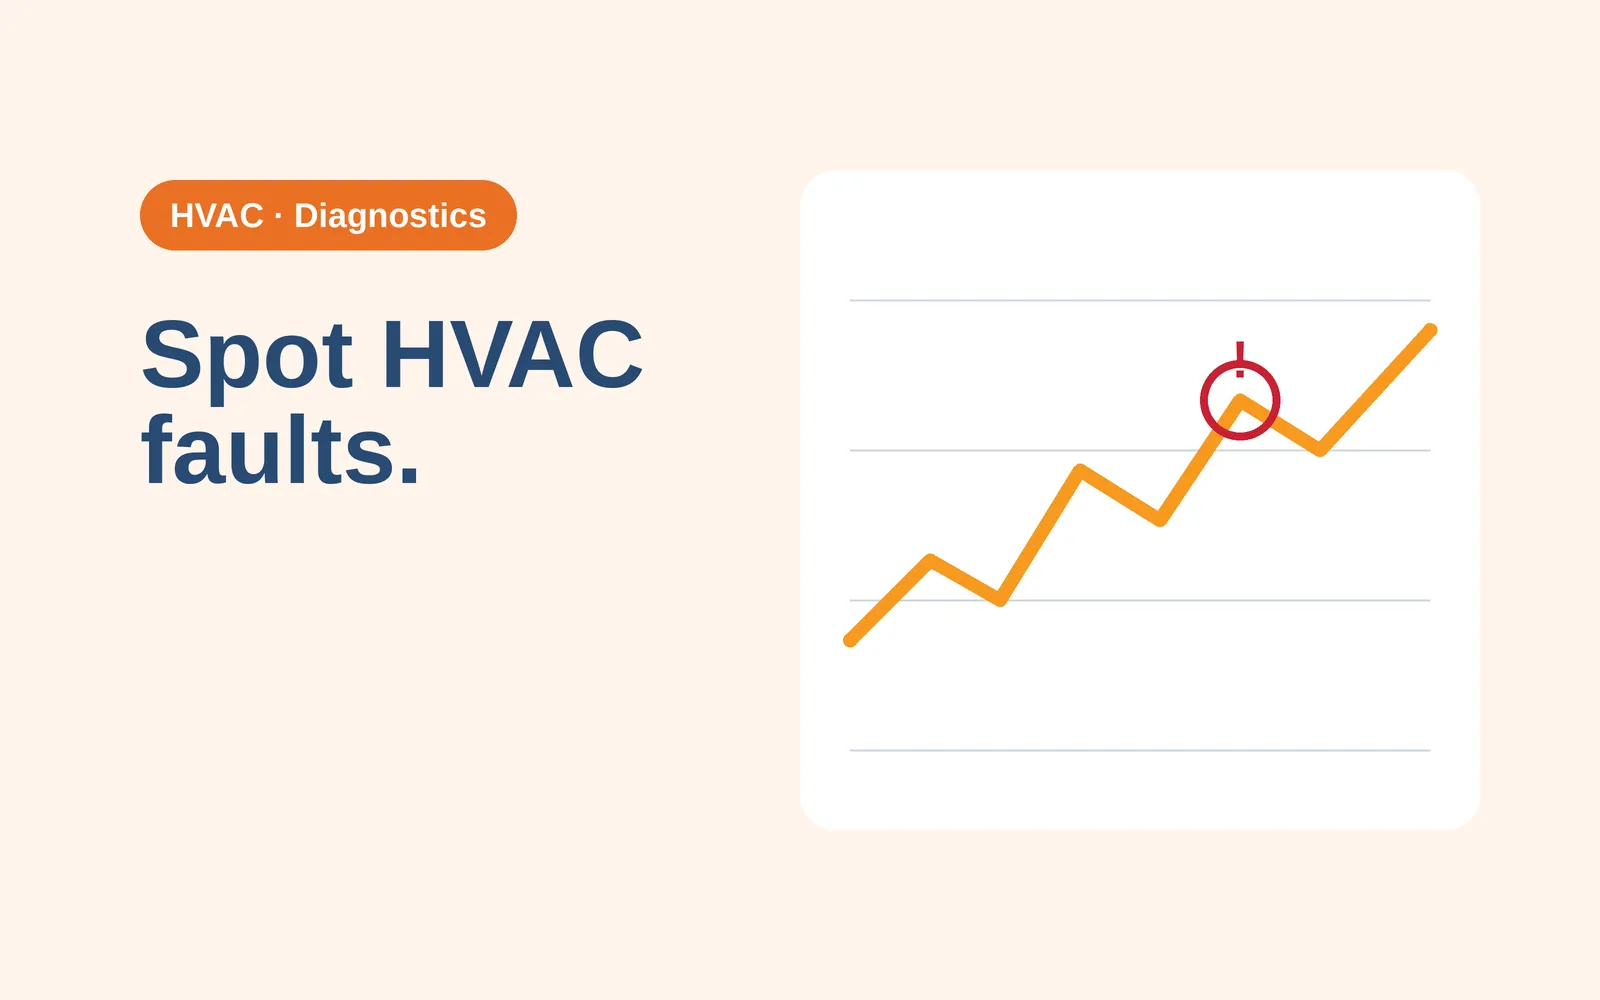
How to spot HVAC faults without a BMS
The HVAC faults found most often, how they show up, and what room sensors, loggers and energy data can reveal in a building that has no BMS.

BACnet and Modbus explained for building owners
BACnet and Modbus are two protocols building equipment uses to share data. Who maintains each, how they differ, and what to ask your installer.

Ventilation in schools: CO2 limits, rules and monitoring
There is no single CO2 limit for schools. What England, Germany, the Netherlands and Ireland publish, what WHO, REHVA and ASHRAE say, and how classroom monitors are used.

Testing air quality in an office: one-off test or continuous monitoring
A one-off test can name a substance or a source. Continuous monitoring shows how air changes with people, weather and season. What each can and cannot tell you, with the sources.
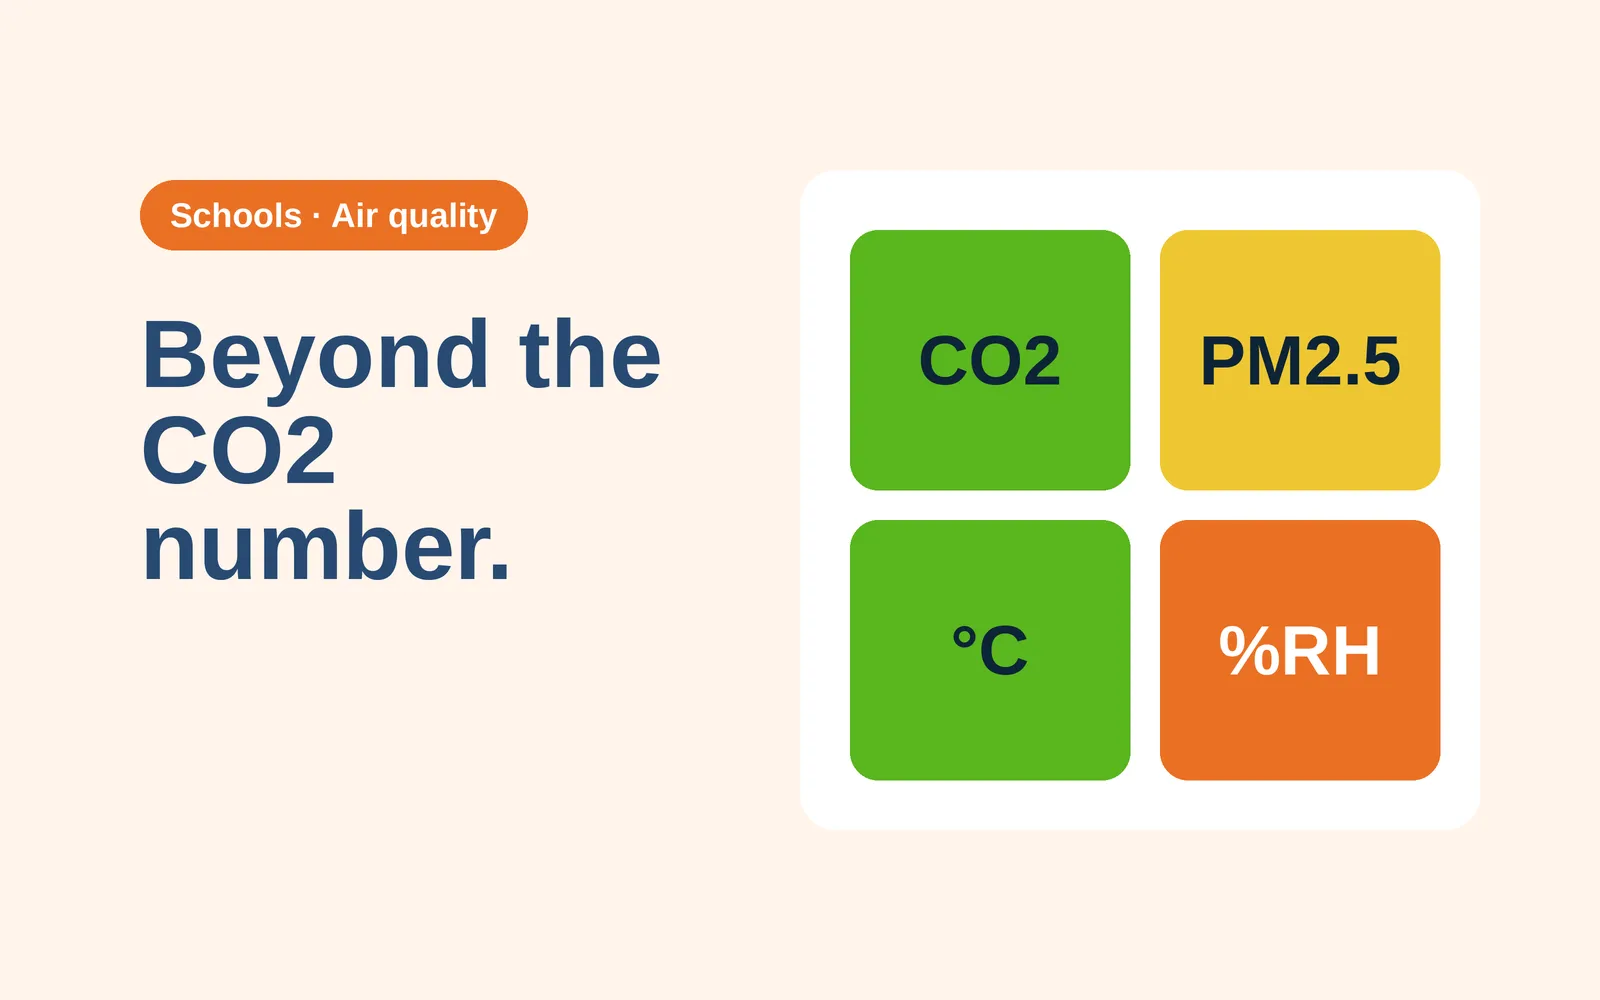
Indoor air quality in schools: what to monitor beyond CO2
CO2 shows whether a classroom is ventilated. Particles, humidity, VOCs, radon and mold need other checks. What a European school study found and what official guidance says to track.
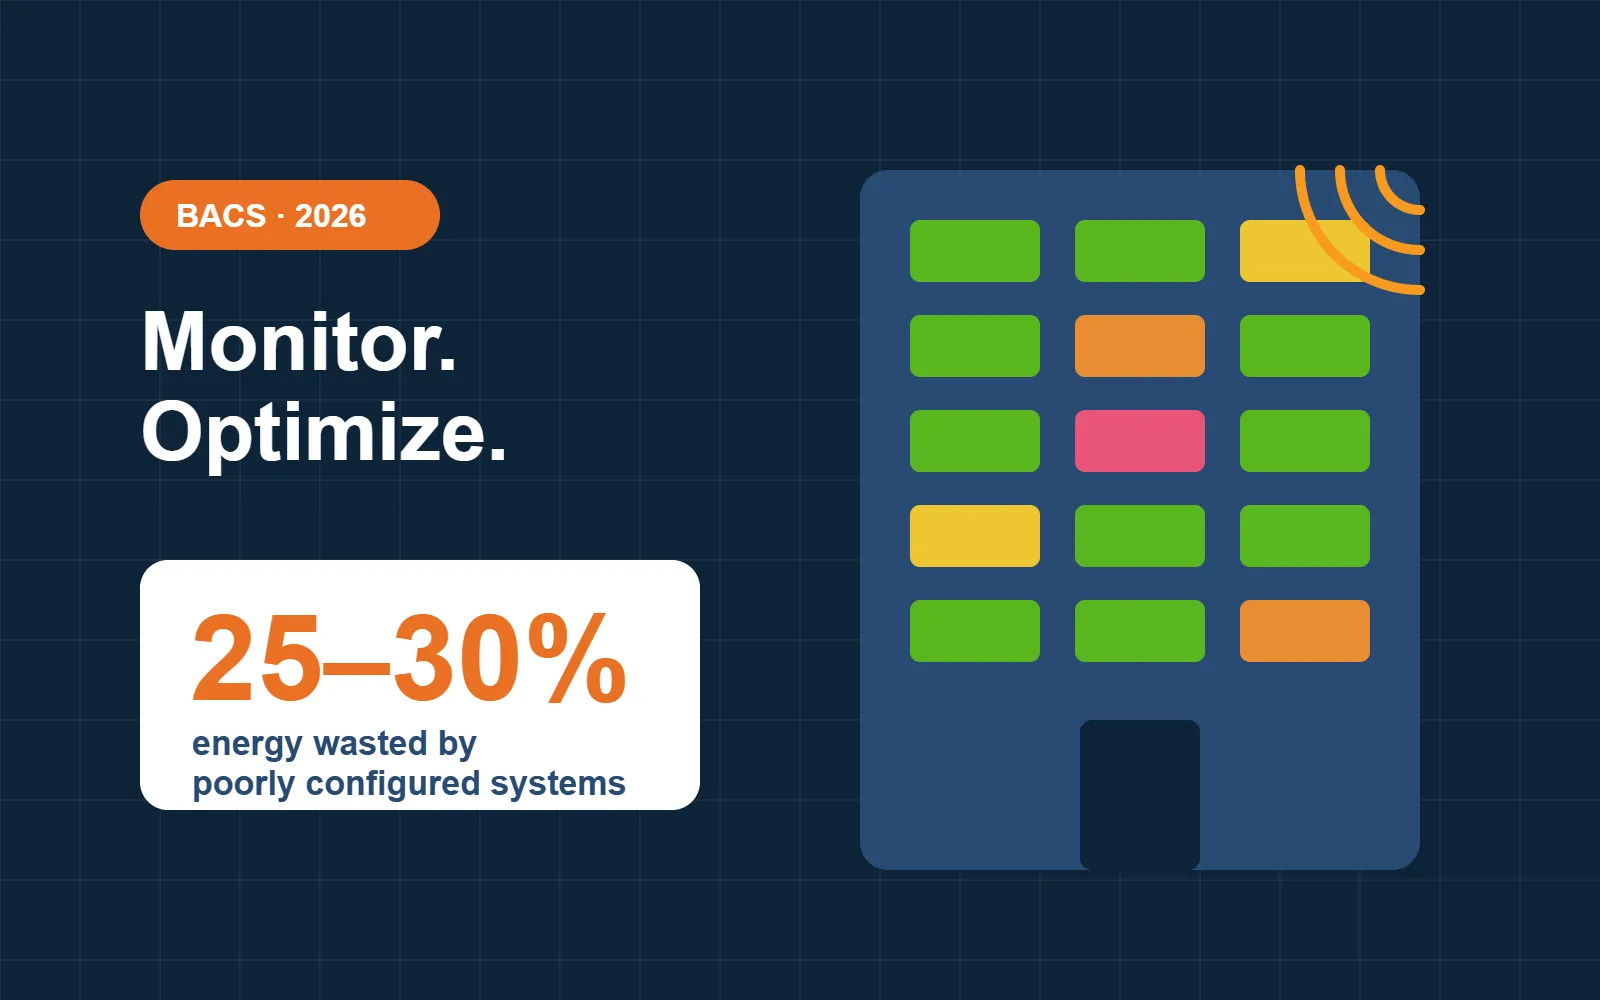
BACS explained: what the 2026 building automation rules mean for you
From January 2026, non-residential buildings with HVAC systems must continuously monitor and optimize their installations. Here is what BACS requires, who it applies to and how to get ready.
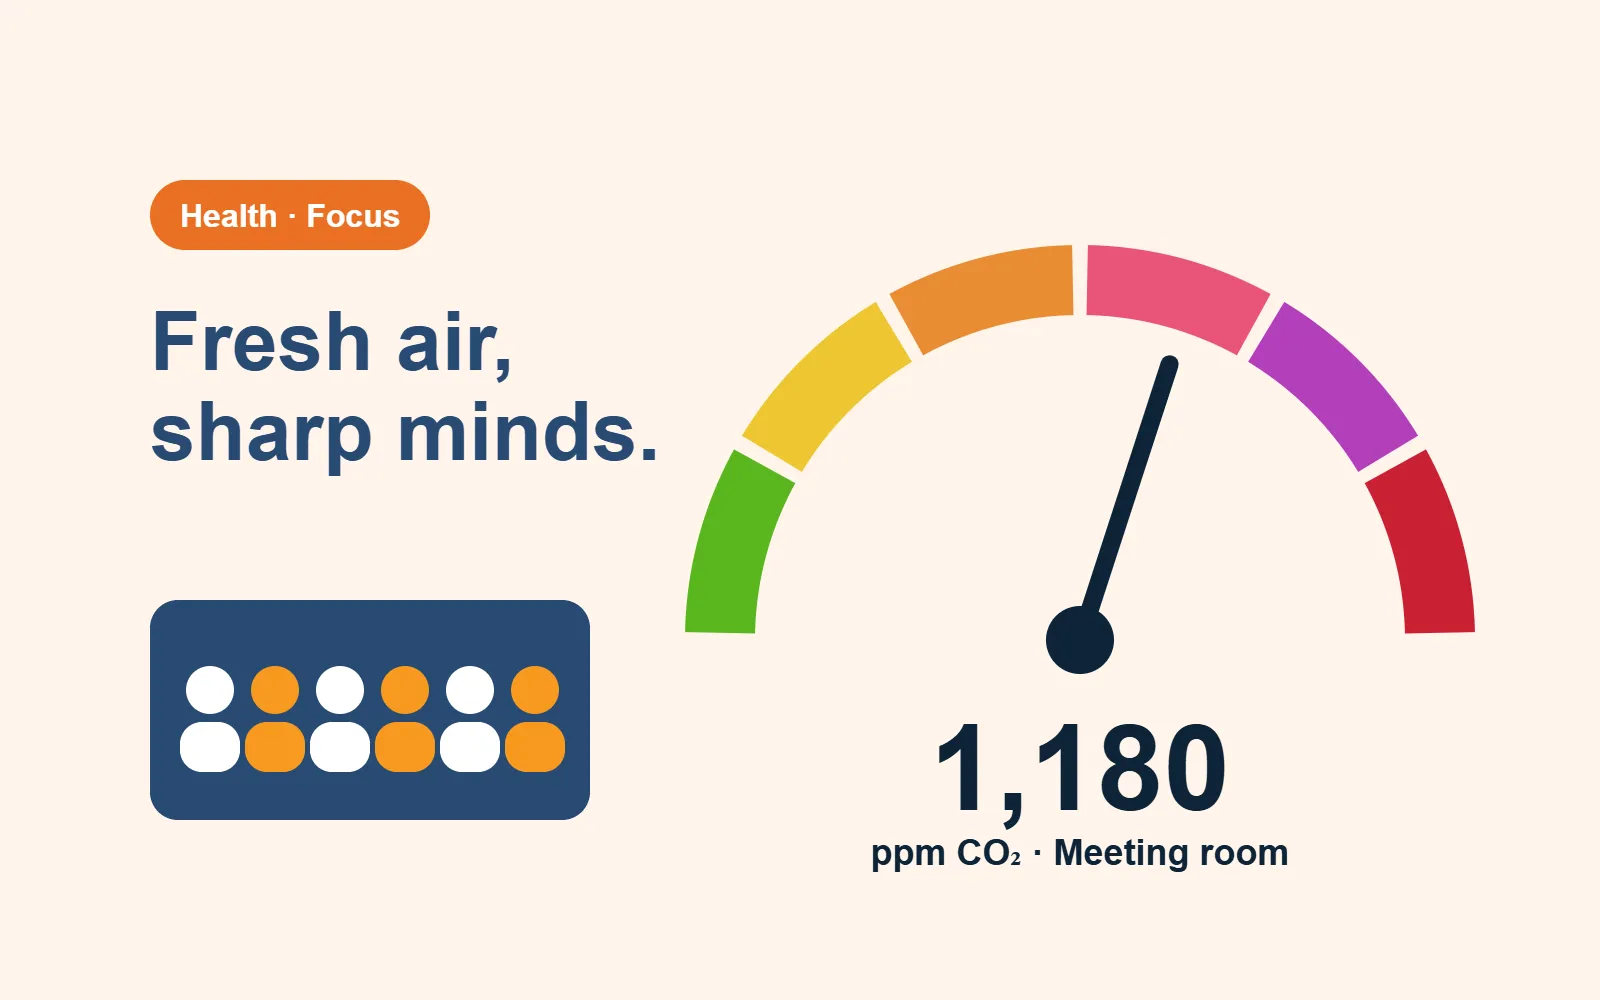
Why stuffy meeting rooms cost you focus, and how to fix them
CO2 builds up fast when a room is full. Learn what the numbers mean, why it matters for health and concentration, and how to fix it without wasting energy.
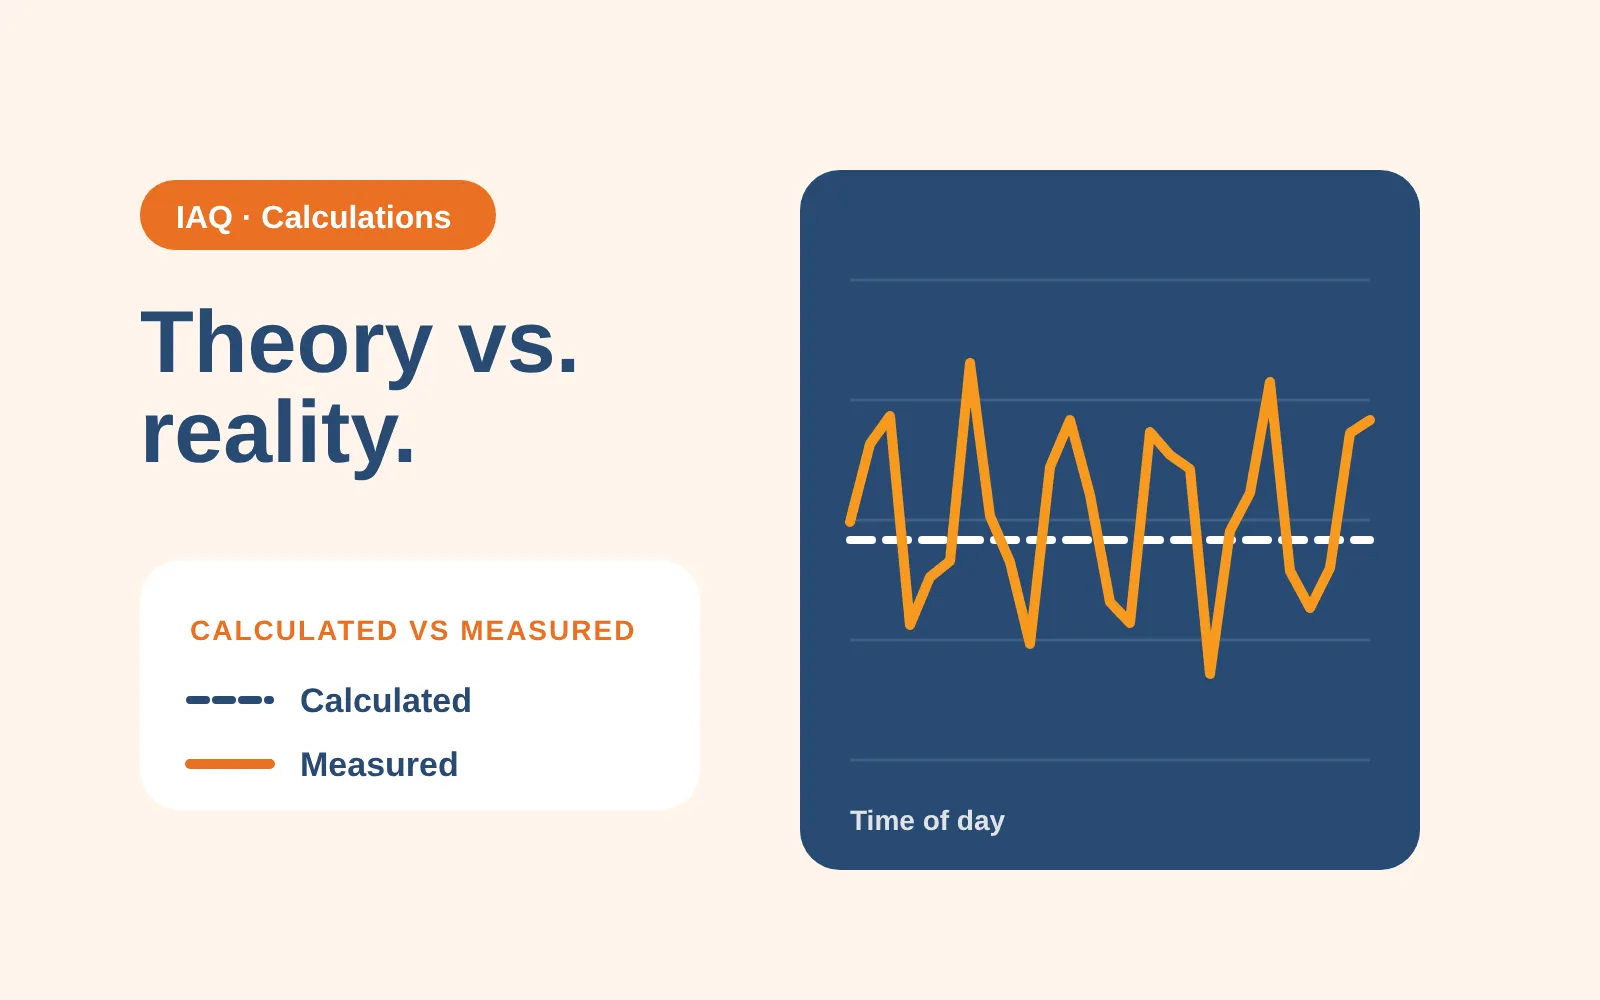
Why static indoor air quality calculations are no longer enough for modern buildings
A mass balance calculation shows what should happen in a room, not what is happening in it. Why buildings need live, room-level data.
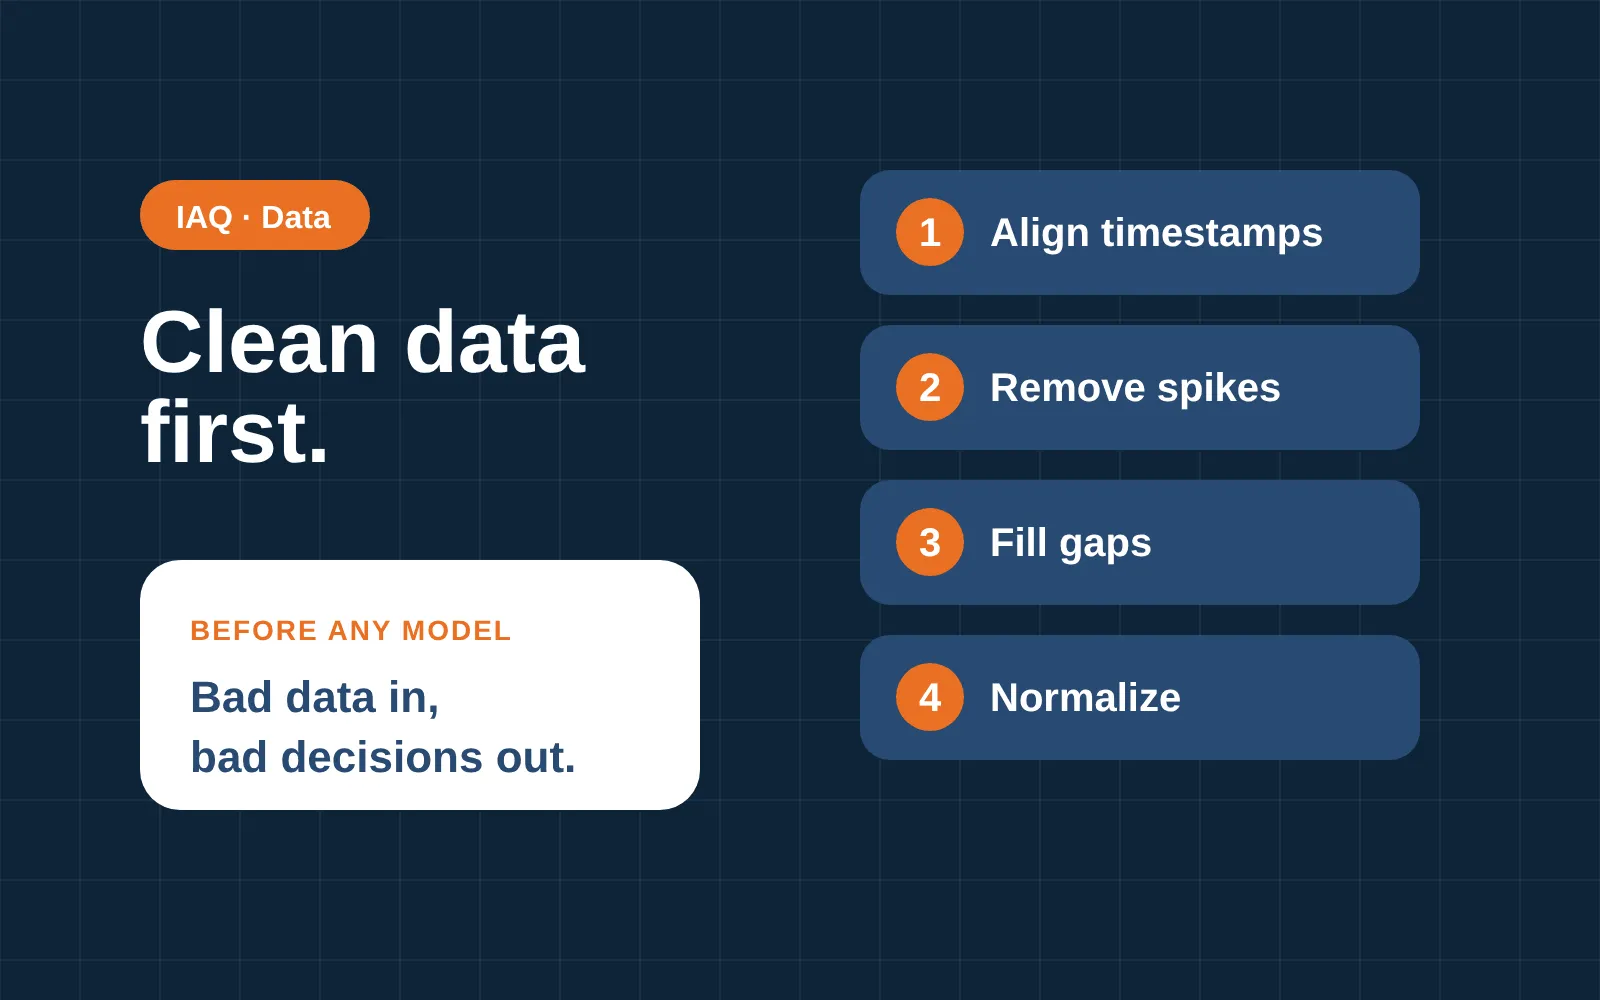
Preparing indoor air quality data for better IAQ modeling
Good indoor air quality insight starts with clean data, not with AI or dashboards. How IAQ data is aligned, cleaned and turned into signals a model can use.
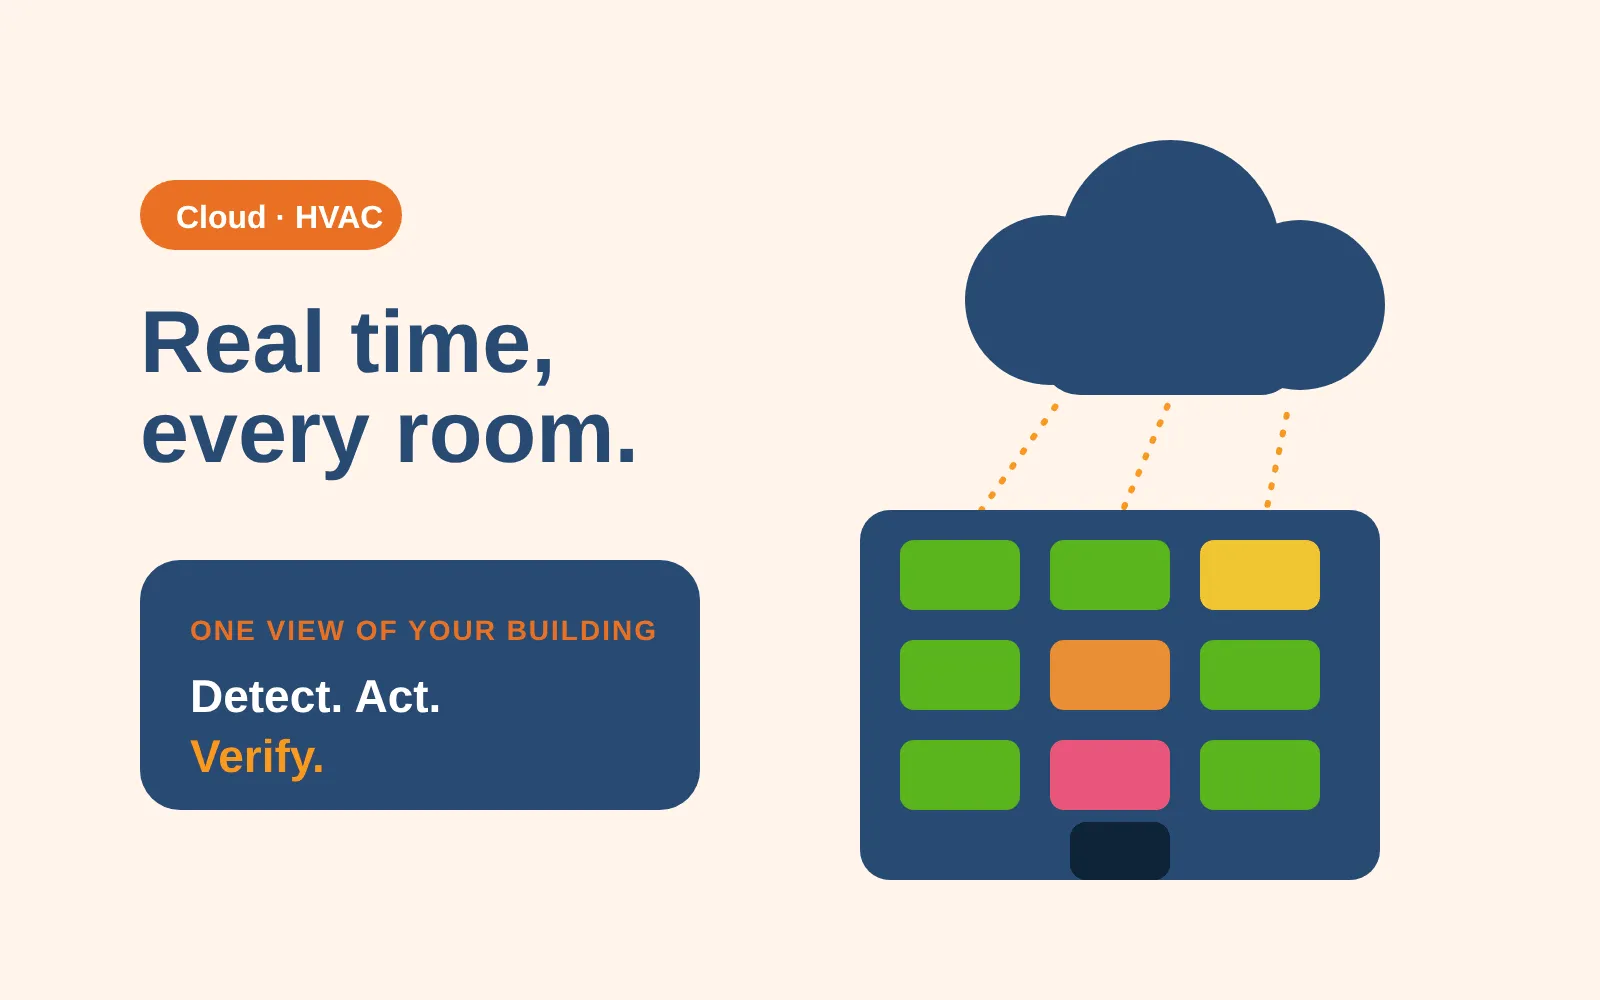
Real-time building management with cloud technology
In a cloud-connected building you see issues as they happen and can act before they grow. What the cloud changes for HVAC and indoor air quality.
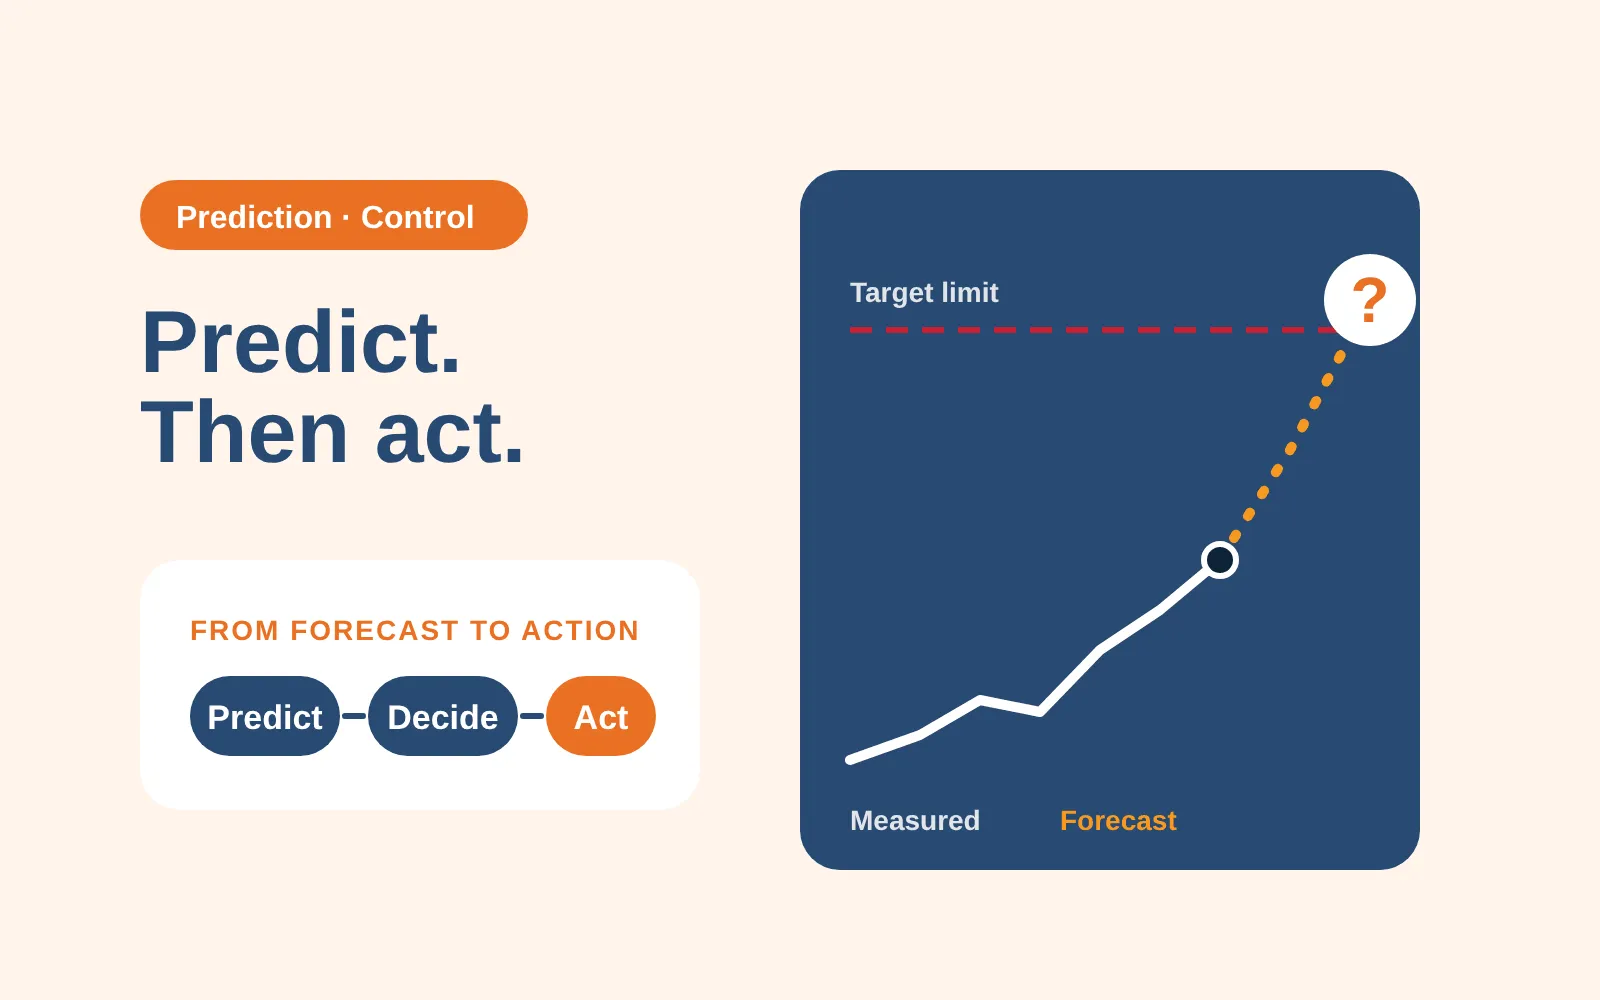
Why predicting indoor air quality is not enough for modern offices
A forecast of CO2 or particulate spikes helps, but it does not tell a building what to do next. Why modern offices need decisions as well as predictions.

From physics-based indoor air quality models to time-series climate intelligence
Physics-based models explain how pollutants move through buildings, but real buildings are never steady. Why teams are moving to time-series climate intelligence.
Get ready for the BACS regulation without changing your existing HVAC infrastructure
Start Without Upfront Investment